

Availability: All plans
This guide plots a legal description from a deed, start to finish, on a brand new account. You create the account, create a project, hand BoundaryLogic Trace the document, and end up reading the tract it drew and the numbers behind it. Every task on the way has its own help article, linked where it comes up.
Trace is built for land professionals: surveyors, title and abstracting staff, right of way agents, and the people who plot descriptions for them. If you pick I’m a homeowner at signup, Trace sends you to MyLotLine, which is built for a single lot; I’m a professional, continue with Trace brings you back through a confirmation if you landed there by mistake.
What you will need
- A deed or legal description as a PDF, PNG, JPEG, TIF, Txt or Docx file.
- An email address you can open. Trace will not let you into the app until the address is verified.
- A card, if you want AI plot credits on your first day. The card step is optional.
1. Create your account
Signup asks who you are before it asks anything else, because the answer routes you to the right product.
- Go to /get-started. The page asks “How will you use Trace?” and offers three audience cards.
- Click I’m a land professional. Ten segment cards appear, ordered by production volume, with title and abstracting first.
- Pick the segment closest to your work, or use Other and type it in. No segment changes your plan or your price, and the subtitle says so.
- Answer “Will anyone else use Trace with you?”. Just me skips the invite step later; the other answer adds it.
- Enter your first name, last name and email. An empty submit returns “Please fill in all required fields.”
- Optional: enter your company. This step also states “You are creating a free account. No card is needed to finish signing up.”
- Set a password. This is the step that actually creates the account, so an error here keeps you on it.
- Open the verification email and click Verify My Email. You see “Email verified”. Return to signup and click I’ve verified, continue. Resend is limited to one email a minute, and asking sooner returns “A verification email was just sent. Wait a minute, then try again.”
- Optional: attach a card to add trial AI plot credits to the account. The panel states “Card on file only. No charge is made now.”, and Skip costs you nothing.
- Click Go to your workspace. Trace opens a new workspace named after your email and seeds an example library in the background, so the projects list is not empty on your first look.
Full detail on each field, on SSO, and on what happens when an invite brought you here: Create your account.
2. Create a project
A project is the container for one job: its documents, its plotted boundaries, and its exports. It takes three steps.
- In the Projects header, click New Project. The same button repeats on the empty projects page when you have none yet. First time through, an intro overlay walks the step once.
- Enter a Project Name. Next stays disabled until the field has something in it.
- Click Next.
- Choose the anchor type, Point of Commencement or Point of Beginning. The choice rides in the URL and each location method’s helper sentence restates it.
- Place the anchor. On the Address tab, start typing and pick a suggestion: Trace geocodes it, fills the coordinates, and recenters the map on the parcel. Lat / Long takes decimal degrees instead, and panning the map until the fixed crosshair sits on your point works too. Next stays disabled until the method yields valid coordinates.
- Click Next.
- Keep Upload document selected, then click Create Project. Trace creates the project and lands you in the add document flow with the upload picker ready.
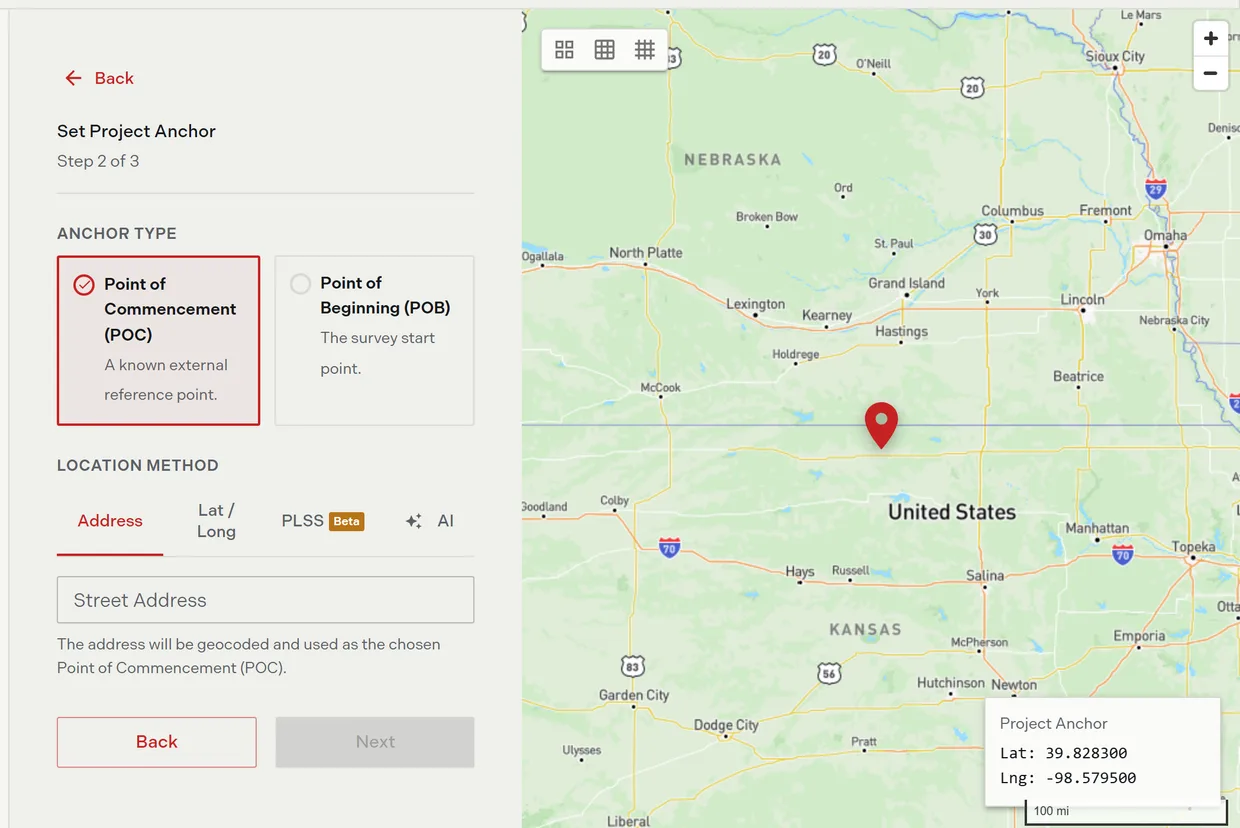
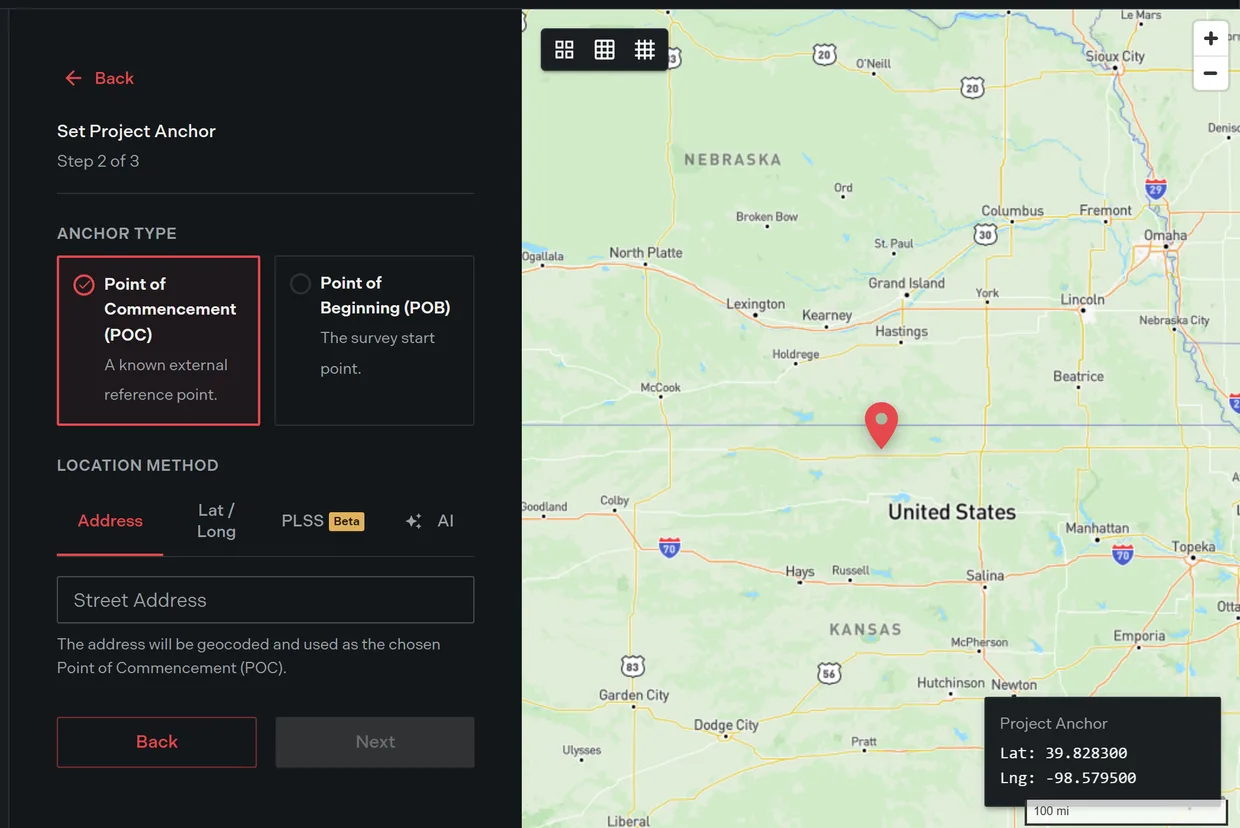
The anchor decides where the plot lands on the map. It is not the geometry: the calls in the description build the shape, and the anchor puts that shape somewhere. If you get it wrong you can move the plot afterwards.
Two things on this screen need a paid plan. The labels field on step 1 is disabled on Free with the tooltip “Available on Professional. Upgrade to label and organize your projects.”, and pressing the PLSS tab on step 2 opens the plan dialog instead of switching. Neither blocks this guide: the Address tab and Lat / Long are open on every plan.
Every field, the leave-without-saving warning, and what happens when creation fails: Create a project.
3. Hand Trace the document
The add document pane is the front door to AI Automated Plotting, and it offers three routes into the same project.
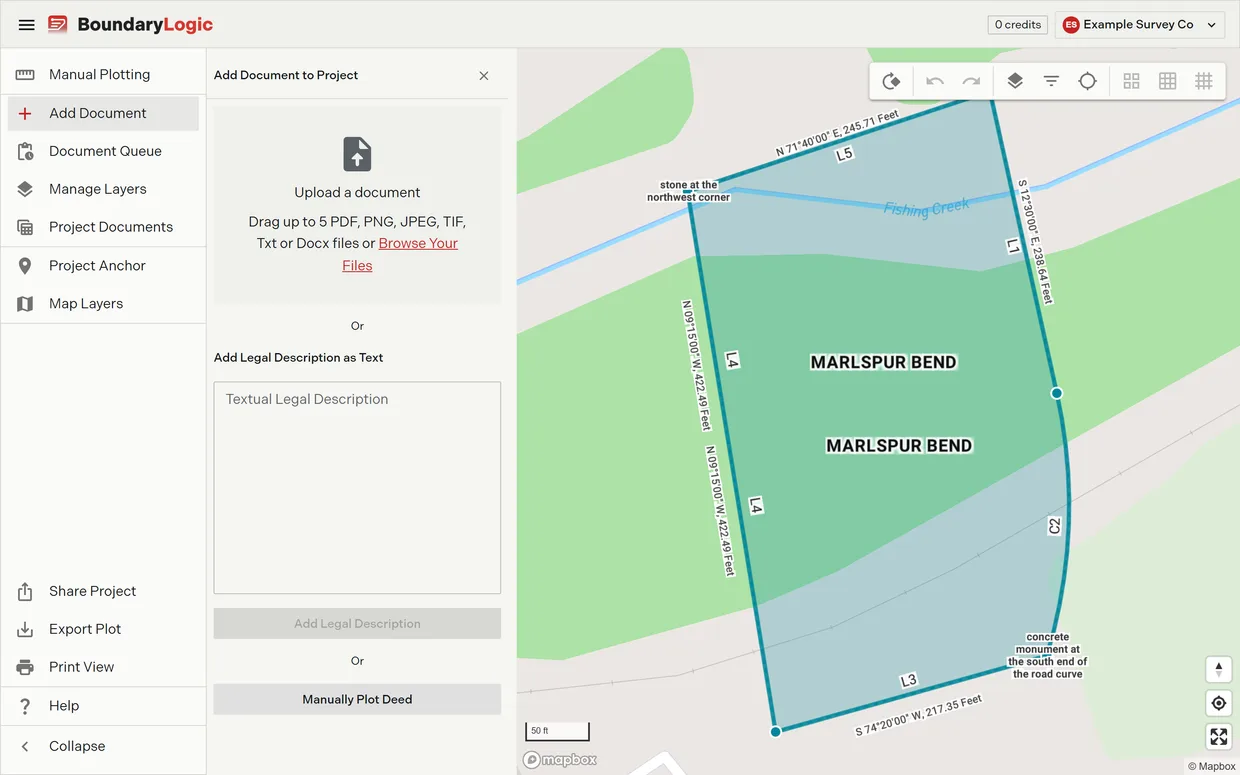
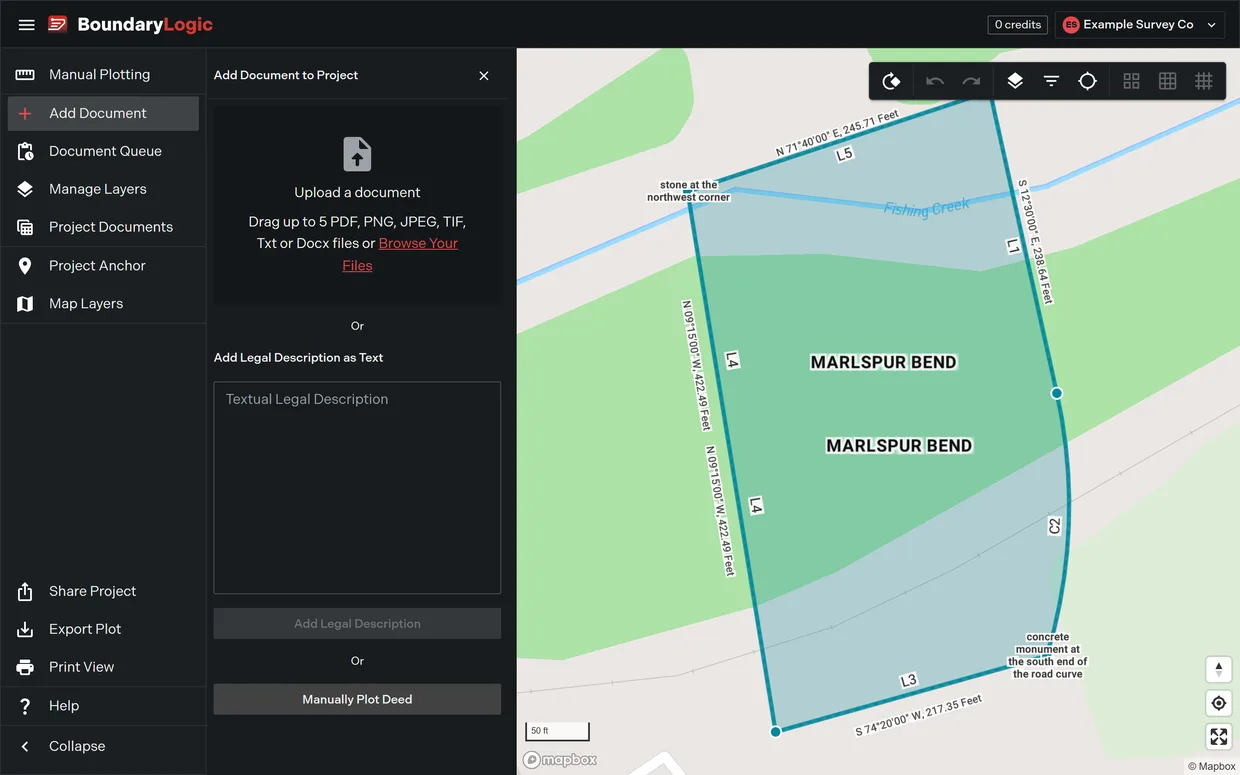
- Drag your file onto the drop zone, or click Browse Your Files. The zone reads “Drag up to 5 PDF, PNG, JPEG, TIF, Txt or Docx files”.
- Wait for the upload to start. Trace reads each file and plots it, spending one AI plot credit. Manual plotting spends none, on any plan.
The other two routes are worth knowing before you need them. Add Legal Description as Text takes a description pasted straight into the Textual Legal Description field, which is the faster path when you already have the wording and no scan. Manually Plot Deed skips AI entirely and opens the editor so you can type the calls yourself.
If you closed the pane and want it back, it is Add Document In the project menu.
What Trace does with each file type, and what it does with a scan it cannot read: Plot from a document. Credits, what spends them and what never does: Credits and plots.
4. Watch it read and plot
Three things happen to your document, in order, and Trace shows you which one it is on.
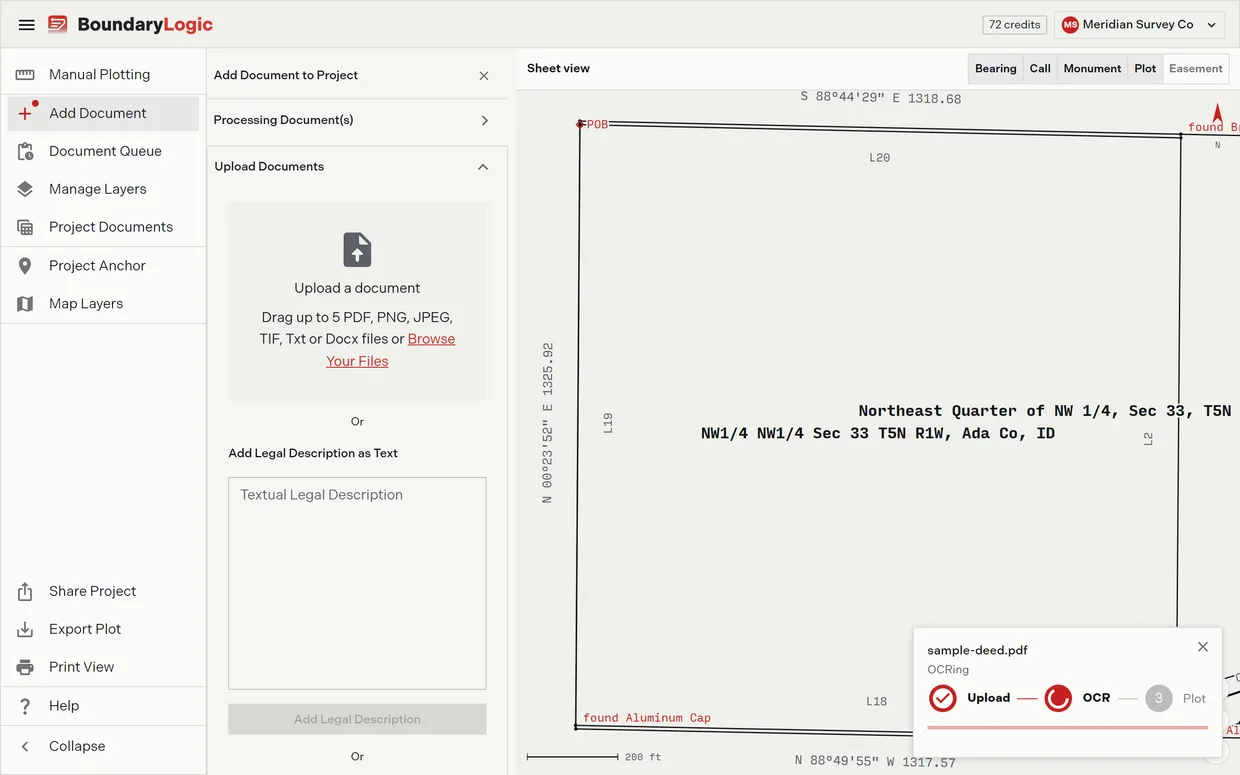
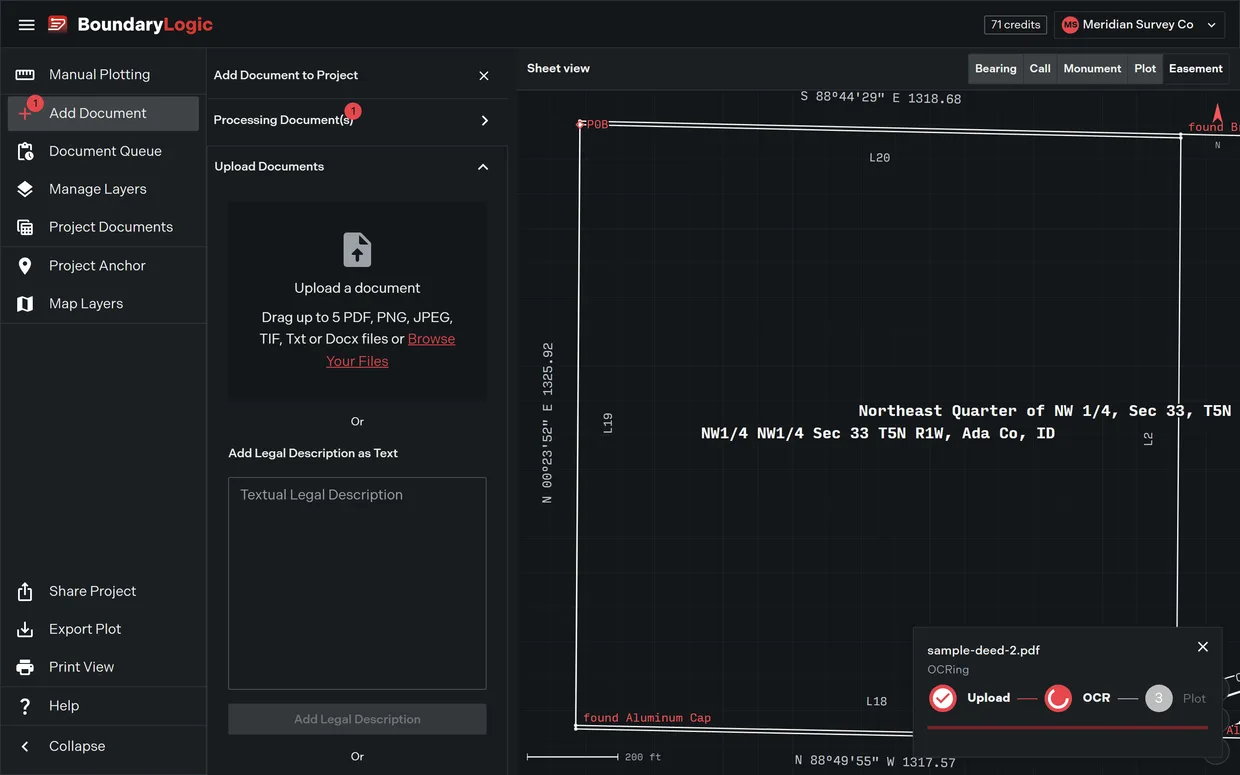
- Read the processing card. It names your file and steps through Upload, OCR and Plot, marking each one as it finishes. The card stays visible over the workspace, and Trace warns you if you try to leave the page mid-run.
- Watch the Add Document badge in the project menu. It shows a dot while a document is processing, then a count of documents that have finished but are not on the map yet.
- When the count appears, open Document Queue in the project menu. Your document is listed as processed.
- Click Add to Project Layers. Trace adds every legal description it read out of the document to the project layers and regenerates the drawing.
Two things you may see instead. A plotting warning flags a description the AI expects to plot badly, such as lot and block wording or internal angles rather than bearings; the plot still happens, and the warning tells you where to look first. A failed document explains why it could not be plotted and offers another AI attempt or deletion. Neither is a dead end: any description can be typed by hand in the editor.
The queue in full, every state it shows: Document queue. When a document fails and what to do about it: When processing fails.
5. Read the boundary, then read the numbers
Adding to layers drops you back on the map with the boundary drawn.
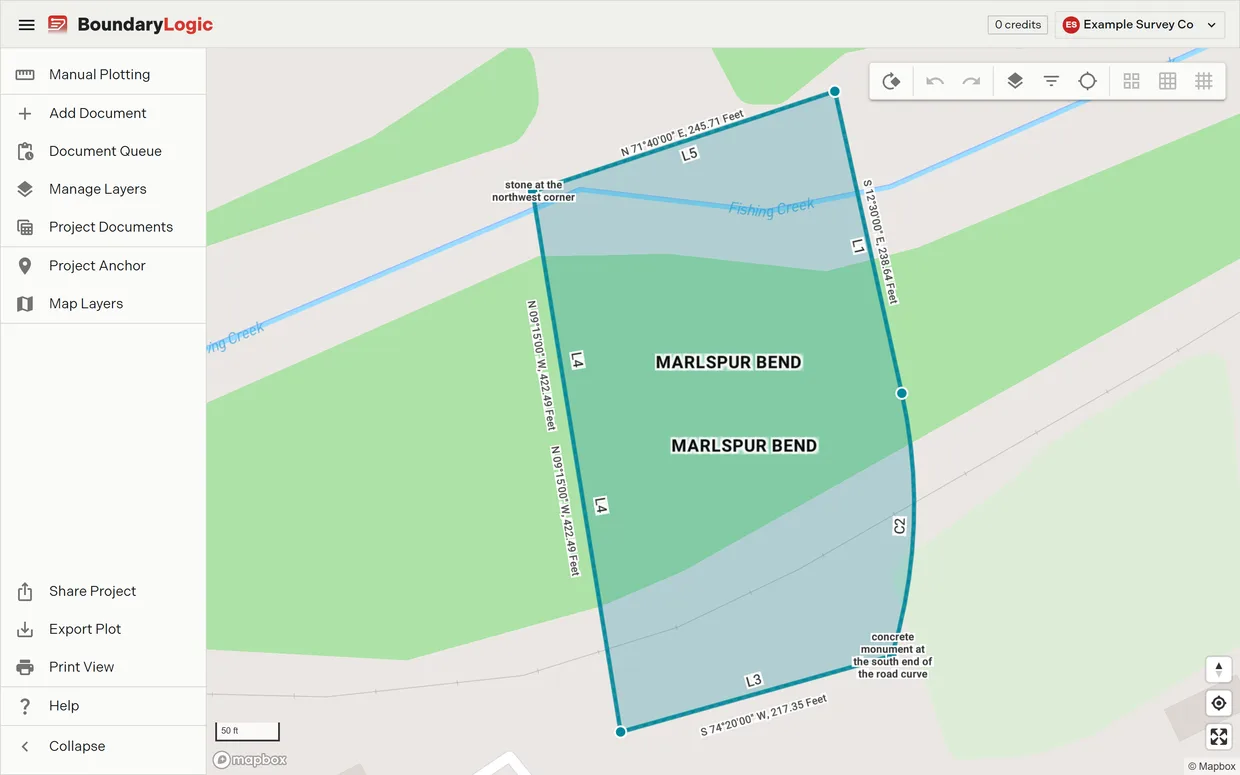
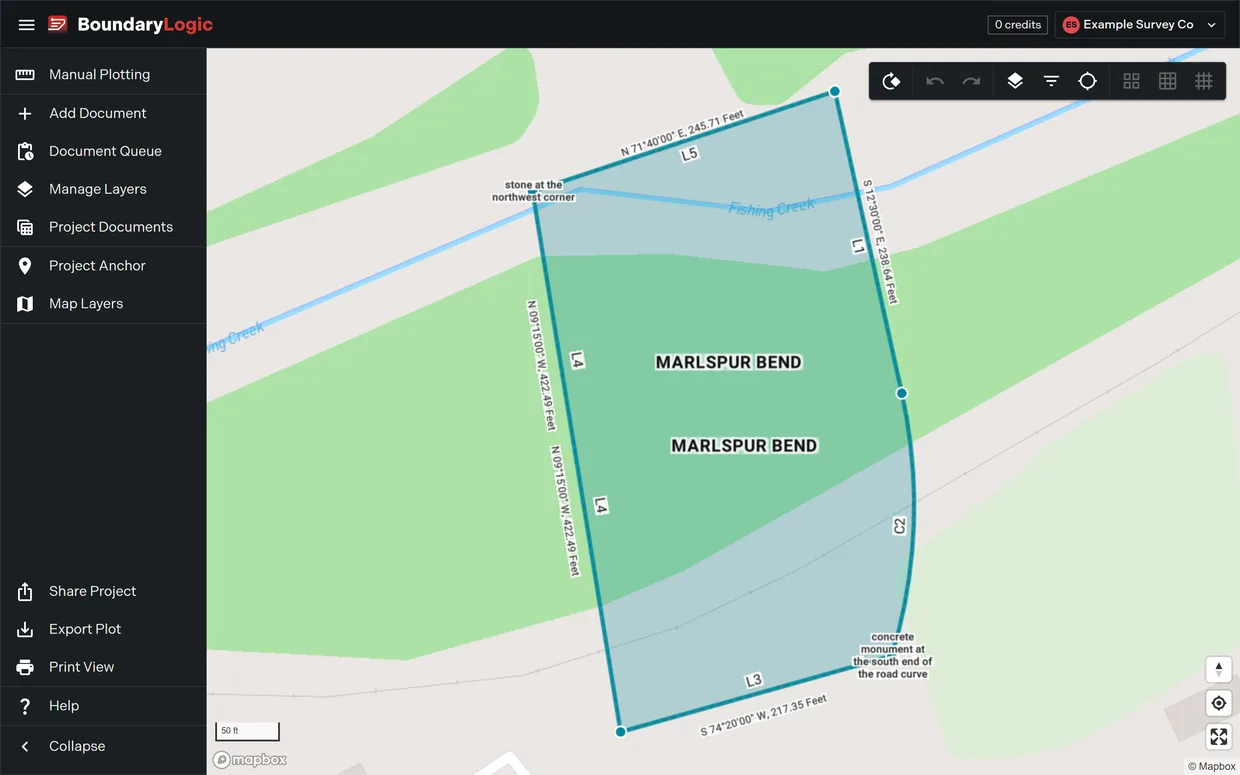
On this first load, with no saved view yet, Trace frames every visible layer so the whole drawing is on screen. From then on it returns this project to the center, zoom, bearing and pitch you left it at, for up to 30 days, on this device. What you are looking at is the record boundary as the document describes it, not a picture of what is on the ground.
Now the data half.
- In the project menu, click Manage Layers. The pane lists every legal description in the project as a card, each one naming the layer and counting its calls.
- Click the card to expand it. The metrics line gives you area, perimeter, misclosure and precision ratio in one read, with the precision ratio color coded. A value is left off when Trace has not computed it.
- Read the source document name under the metrics. It tells you which upload this boundary came out of, which matters the moment a project holds more than one.
- Scroll the card to the deed text. Each call is shaded in the wording it came from, and hovering one explains it. Long descriptions truncate at 150 characters with Show More.
- Click a call in the calls list. The map flies to that course at close zoom, so you can walk the traverse call by call and see where the AI put each one. Clicking it again clears the selection.
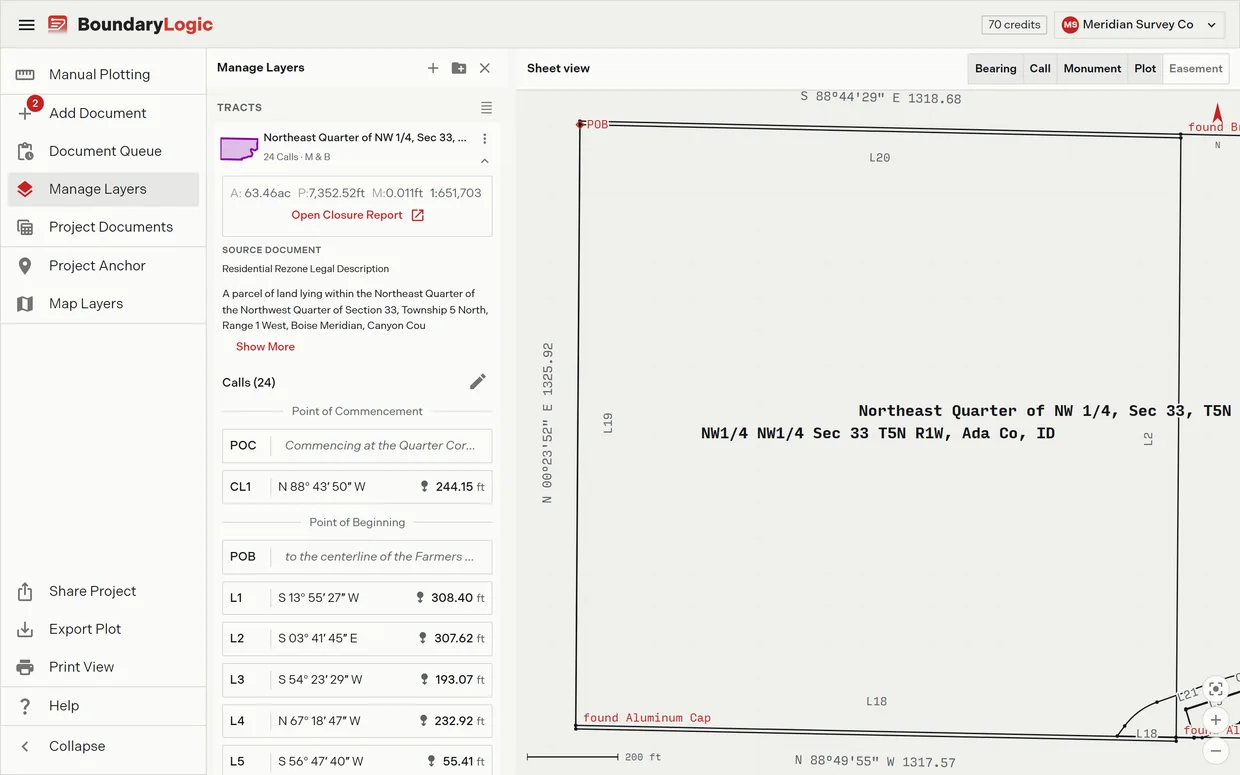
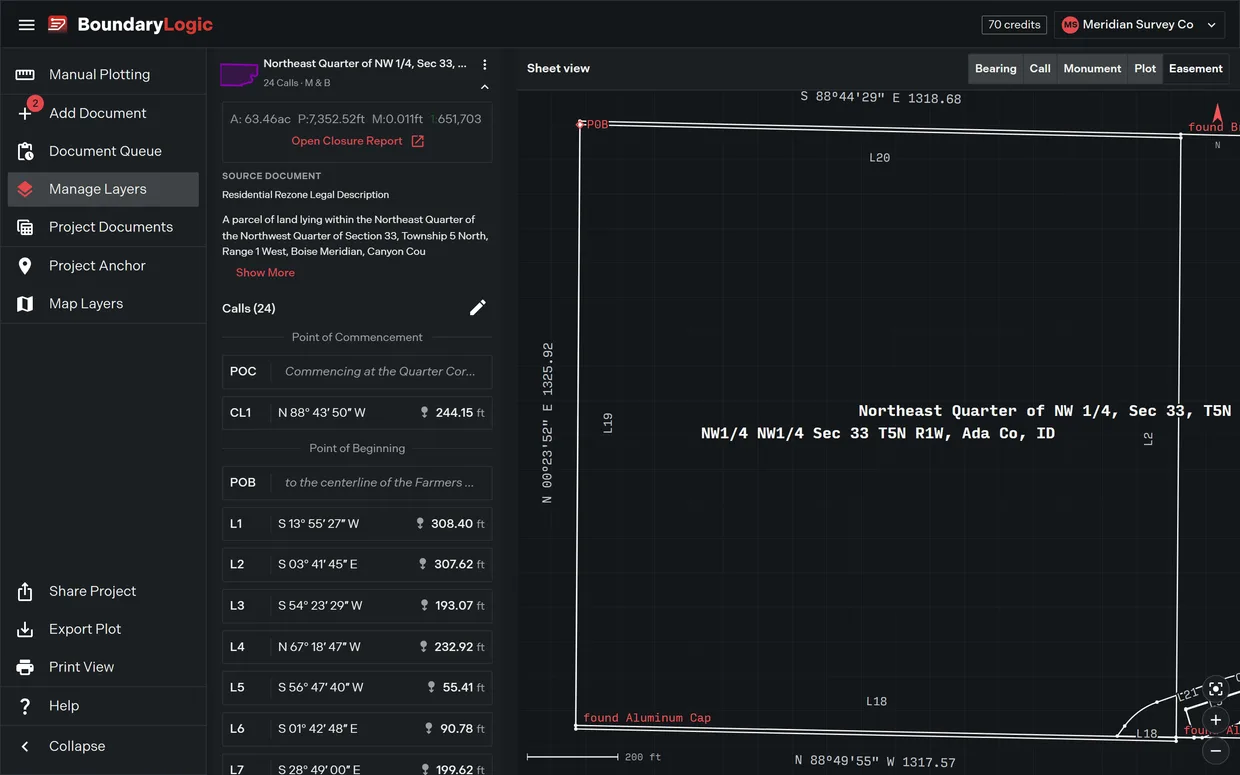
That metrics line is the check, and Trace shows it rather than ruling on it, so the reading is yours to make. Open Closure Report on the card gives you the same four figures with the misclosure components and the closure bearing back to the point of beginning behind them.
You now have a plotted legal description with its area, its perimeter and its closure on screen. That is one pass through Trace.
Where to go next
- Create your account, for signup in full: SSO, invited accounts, and every error signup can show.
- Plot from a document, the canonical procedure for the upload path.
- The map workspace, for the project menu, the toolbar and the three context menus.
- Create a project, for the wizard field by field.
- Document queue and When processing fails, for everything the queue can tell you.
- Manage Layers, for the card, its menu, groups and ordering.
- The closure report and Verification checks, for reading closure, precision, area and perimeter.
- Credits and plots, for what spends a credit and what never does.