

Availability: Expert and Enterprise · Role: owner or admin
Summary
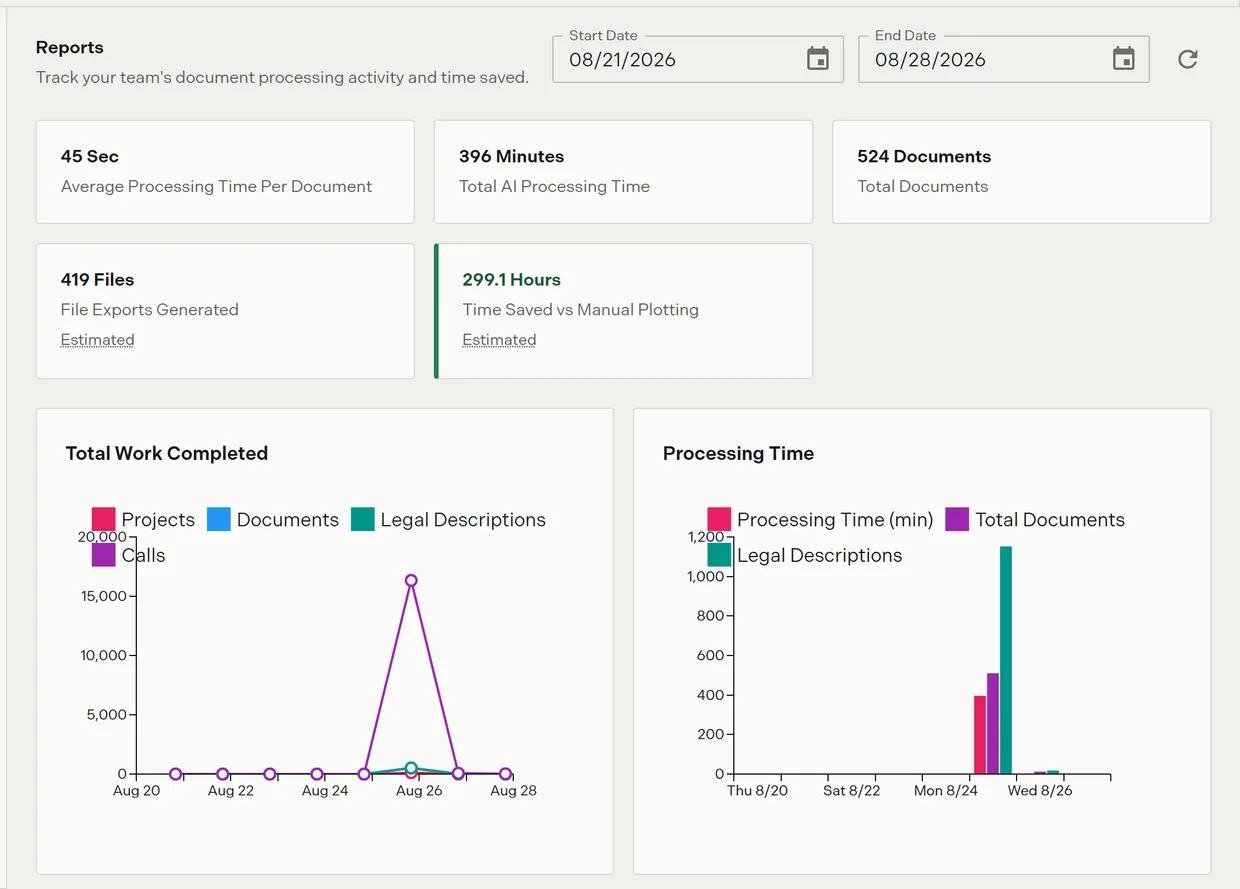
Reporting shows what your team processed over a date range: how many documents and legal descriptions went through, how long processing took, and how that breaks down by person. It is the page to open before a capacity conversation or a monthly review.
Usage notes
Setting the range
The page opens on the last 7 days. Set Start Date and End Date to change it. The start cannot pass the end, the end cannot pass today, and the end date includes the whole of that day. The refresh icon refetches without changing the range.
The five cards
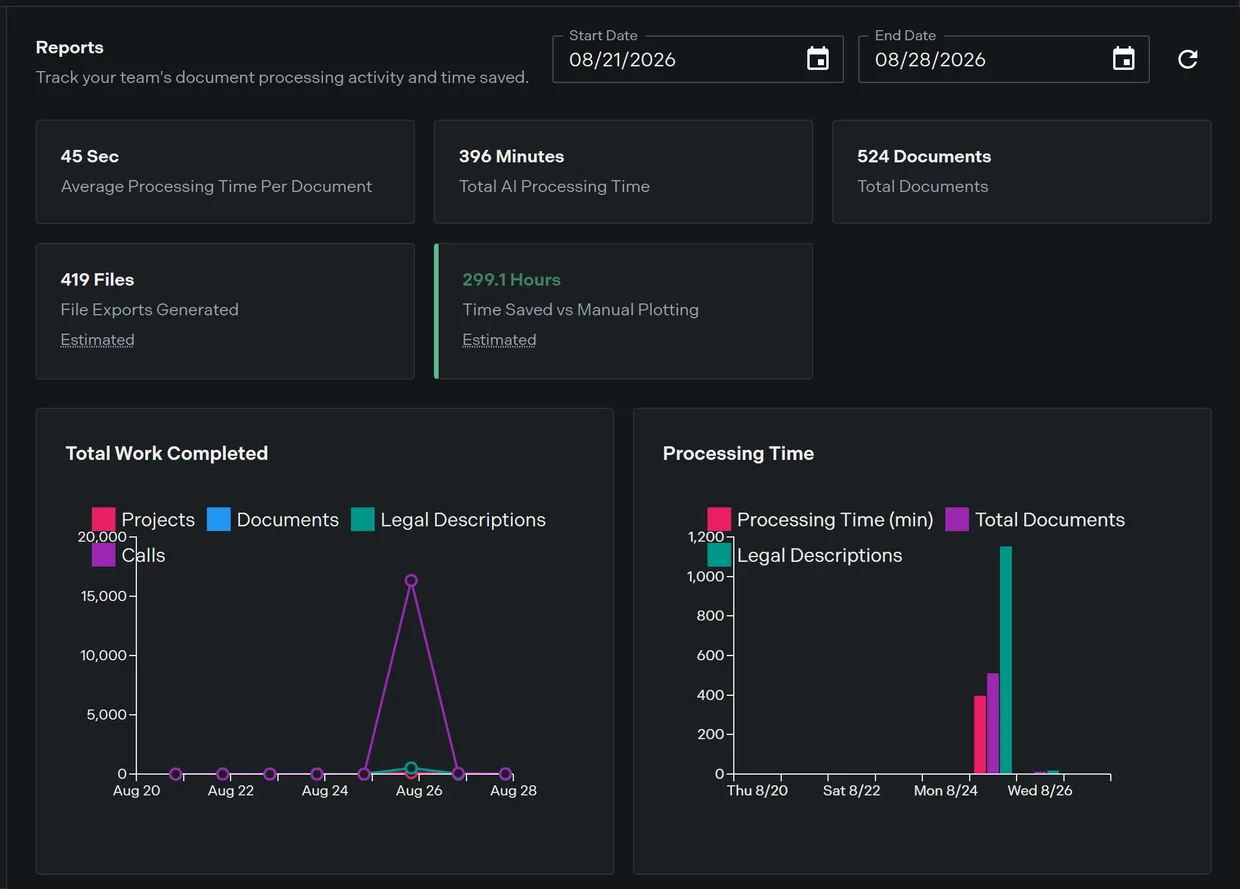
Across the top: Average Processing Time Per Document, Total AI Processing Time, Total Documents, File Exports Generated, and Time Saved vs Manual Plotting.
Two of those five are estimates and are labeled as such. File Exports Generated is derived from the number of documents processed, not counted from actual exports. Time Saved vs Manual Plotting is measured against an assumed 35 minutes per deed; it is an assumption you can reason with, not a measurement of your team.
The two charts
Total work completed plots projects, documents, legal descriptions and calls per day across the range. Processing time plots processing minutes against documents and legal descriptions per day. A range with no activity reads “No data available for this date range.”
Per person
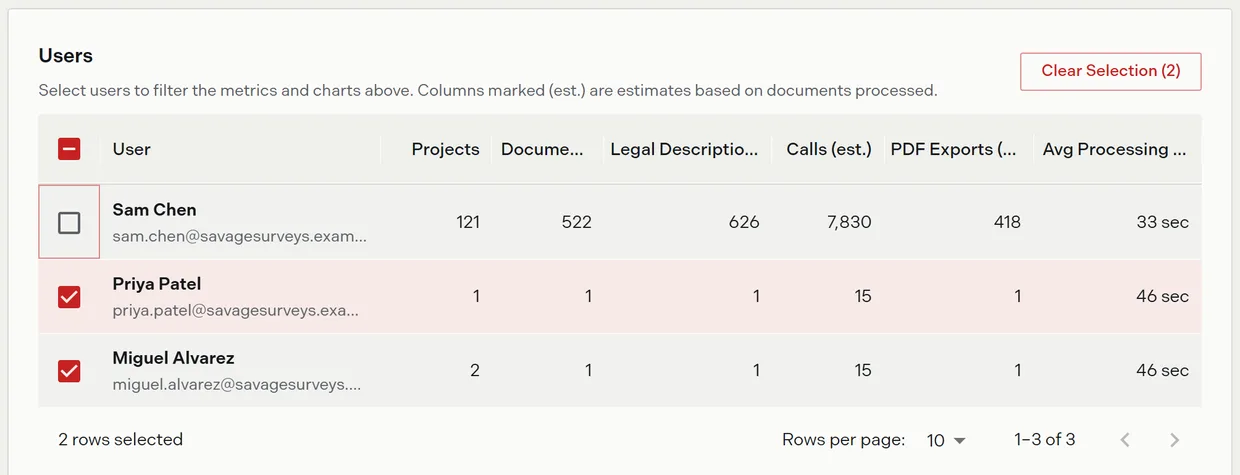
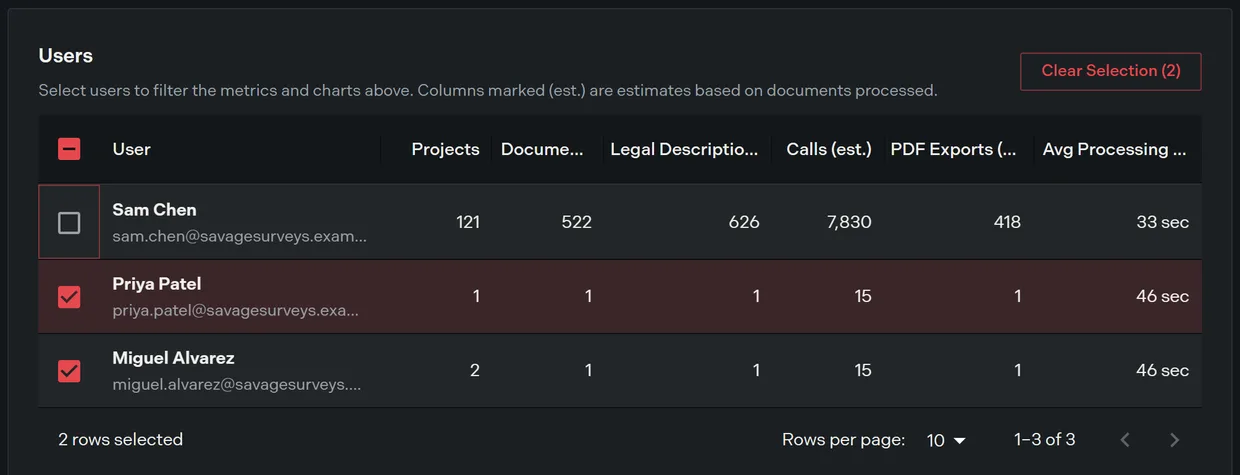
The user activity grid lists every member with their projects, documents, legal descriptions, calls, PDF exports and average processing time. The counts marked as estimates carry the same caveat as the cards. Page it at 10, 25 or 50 rows.
Ticking one or more rows filters the whole page to those people: the cards recalculate, the charts rescale, both retitle with the number of users selected, and a Clear Selection button appears. Estimated figures scale by the selected people’s share of documents rather than being recounted.
Options
| Control | What it does |
|---|---|
| Start Date, End Date | Set the reporting window. Defaults to the last 7 days. |
| Refresh | Refetches the current range. Disabled while a fetch is running. |
| User row checkboxes | Filter every card and chart to the selected people |
| Clear Selection | Return to the whole team |
When it will not load
A failed fetch reads “Unable to load reporting data. Check your connection and try again.” with a Retry button.
Reporting needs Expert or Enterprise. Below that the page is replaced by an upsell card. Owners get an upgrade route from it; admins and members get a button that emails the billing contact instead.
Related
- Credits and AI plots, for what a processed document costs
- Seats and credit pools, for sizing the team against this usage
- Plans and billing, for who can open the Team pages