

Availability: All plans. Role: edit access on the project.
Summary
The manual plotting workspace is where you type a legal description and watch it draw. One document’s tracts live in a single text editor beside a live plot sheet, and Trace re-works the traverse, redraws the sheet and restates the results as you type. Manual plotting is free forever: it is open on every plan and it uses no credits.
There is no save button. The workspace saves itself on every pause in typing. How the editor saves your work covers what that means for your document.
Usage notes
How the workspace is laid out
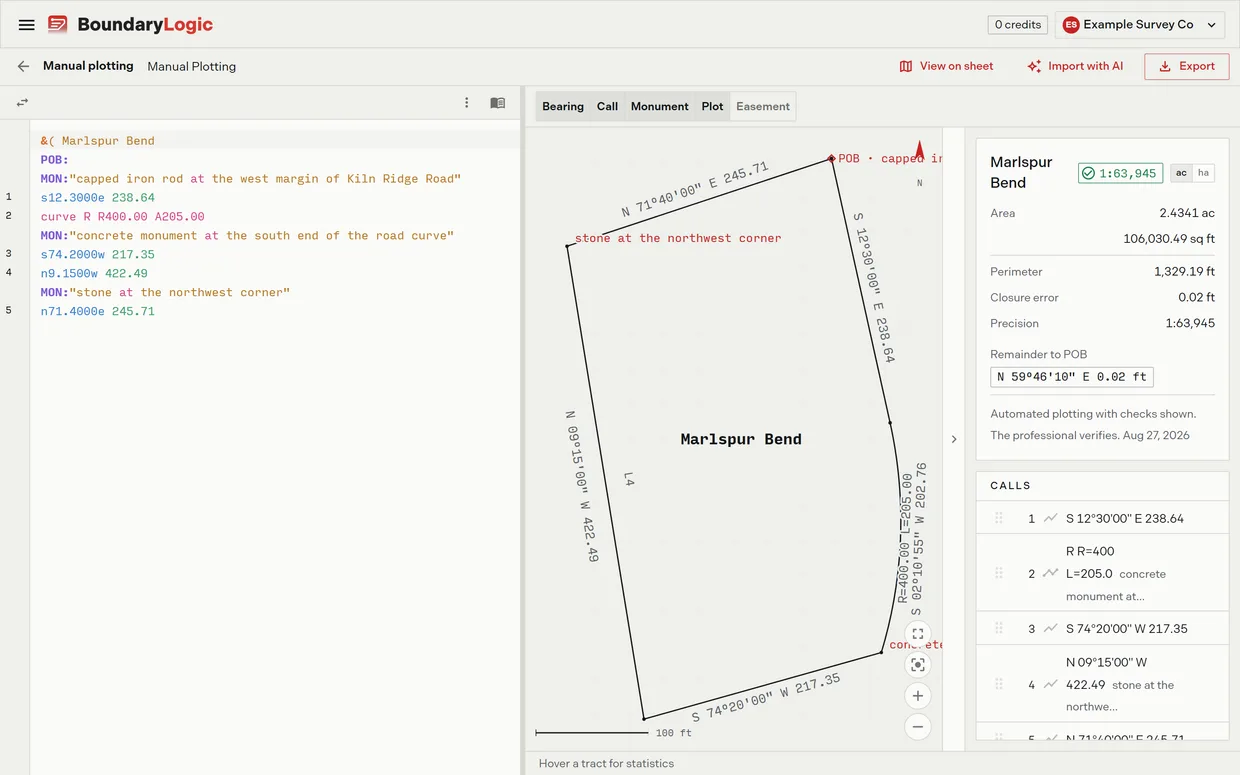
Three columns, left to right: the deed editor, the plot sheet, and the results panel holding the tract card and the calls list. A status bar runs along the bottom. The project sidebar and the map keyboard shortcuts are deliberately absent so nothing competes with the editor.
The workspace header
The back arrow returns to the project map. The document title beside it is an editable box: type in it to rename the document in place. Emptying the box is treated as an edit in progress, so the stored name survives while you retype it.
View on sheet hides the editor and the results panel so the plot fills the workspace, and the button then reads Exit sheet view. Escape restores both panels. Import with AI leaves for the add document page, and it is the only path out of this workspace that spends a credit.
Export offers a PDF plot sheet and a drawing or data file. Both flush pending edits first, so an export never uses the document as it was a moment ago. Export formats covers what each file carries.
The editor toolbar
Change document switches to another document in the same project. The save status badge sits beside it. Then the quick commands, which write a block of correct syntax into the document for you: New tract, New easement, New line, New curve and PLSS, plus Coords to calls when the document holds coordinate lines. The manual plotter guide is the book icon at the end, and it stays visible at every window width.
At narrow widths the row folds: Change document and the guide become icon buttons and the quick commands move into an More options menu holding the same set.
What the plot sheet draws
Every active boundary call of every tract, with curves drawn as true arcs rather than chords and a solved call drawn dashed. Commencement ties draw dashed in a muted colour, separate from the boundary. Reference calls draw finely dotted, outside it. A centerline tract draws its baseline in a dash dot pattern plus the outline of the corridor it generates.
A diamond marker labels the point of beginning or point of commencement, with the point’s monument description appended when one is recorded. A dot marks every boundary vertex. Behind all of it sits a fixed 40 pixel reference grid, a north arrow at the top right, and a scale bar at the bottom left labelled with a round number of feet chosen to sit near 100 pixels at the current zoom.
The five label buttons above the plot read and write the same settings the project map uses, so a change here follows you there. Labels and markers on the map covers them.
Working on the plot sheet
Hover a tract to read its statistics in the status bar without changing anything. Click it to select it: a dashed accent outline and a light fill appear, and the results panel follows. Each further click moves to the next tract under the pointer, so overlapping tracts stay reachable. Click empty space to deselect.
Drag a selected tract to move it on the sheet. BoundaryLogic Trace rewrites the tract’s coordinate origin line to match, inserting one where the tract had none. The move cursor appears only over the tract that is already selected; a press anywhere else pans the view. The wheel zooms about the pointer, holding the world point under the cursor still, and the zoom buttons step a fifth in or out from the centre.
Fit to extents rescales and recentres so every tract, tie and corridor fits with a margin. Trace fits once by itself when geometry first appears and on a container resize, then stops once you have panned or zoomed. The plot’s own full screen control gives the same state as View on sheet and reads Exit full screen (Esc) while active.
The calls list
Under the tract card, the selected tract’s commencement ties then its boundary calls, each with its number, an icon for its kind, and its bearing and distance. A curve reads as R R=100 L=157.1. A monument on a row is cut to twenty characters, with the whole description on hover. An omitted call stays listed, struck through and dimmed. A solved call is marked with the word solved.
Hover a row and its drag handle appears. Drag one boundary row onto another to reorder the calls: a line on the edge of the target row shows where the dragged call would land, and Trace asks Move call 4 above call 2? before touching anything. Confirm and the editor text is rewritten to match the new order; cancel and the text is untouched. Commencement ties cannot be dragged and refuse a drop.
The tract card above the list carries the area, perimeter, closure error, precision and remainder. The checks Trace shows covers those readouts.
The status bar
One bar, three jobs. It reads the error on the line your cursor sits on, as Line 4: Bearing must be 0-90 degrees. Failing that it reads the statistics of whatever tract you are hovering. Failing both it reads Hover a tract for statistics.
Sizing the panels
Drag the divider between the editor and the plot to anywhere from a quarter to seventy percent of the workspace; it opens at 42 percent. Trace stores the position and restores it on your next visit. Collapse results hides the tract card and calls list so the plot takes their width, and the control then reads Show results. Whatever state the panel was in comes back after a round trip through sheet view, and so do the editor’s undo history, cursor and scroll position.
Switching documents
Change document lists the project’s documents with their tract counts and last update dates, and marks the open one Current. The search box filters on document name or file name and carries a clear button. The same dialog creates a document: name it and Trace opens it holding one legal description named Tract A.
Options
| Control | Where | What it does |
|---|---|---|
| Document title box | Header | Renames the document in place |
| View on sheet | Header | Fills the workspace with the plot; Escape returns |
| Import with AI | Header | Leaves for the add document page |
| Export | Header | PDF plot sheet, or a drawing or data file |
| Change document | Toolbar | Switches, searches or creates a document |
| Save status pill | Toolbar | Reports the state of the automatic save |
| Quick commands | Toolbar | Write a tract, easement, line, curve or PLSS block |
| Manual plotter guide | Toolbar | Syntax topic by topic with insertable examples |
| Label badges | Above the plot | Bearing, call, monument, plot name and easement width labels |
| Fit to extents | Plot sheet | Rescales so everything fits with a margin |
| Divider | Between editor and plot | Resizes the editor from 25 to 70 percent |
| Collapse results | Results panel | Gives the plot the results panel’s width |
Related
- Deed syntax reference, for every call form the editor accepts
- Editor tips and shortcuts, for selection, autocomplete and the keyboard
- How the editor saves your work, for what the save status badge is reporting
- The checks Trace shows, for the tract card statistics
- How to plot a metes and bounds description, to work through one from zero