

Availability: All plans · Role: edit access
Five parcels in one blue is a drawing nobody can read. Give the subject tract its own color, and drop the opacity on whatever sits underneath it.
Before you start
- You need edit access to the project.
Set a plot color
- Right-click the plot and choose Set Plot Color, or select the plot and press C.
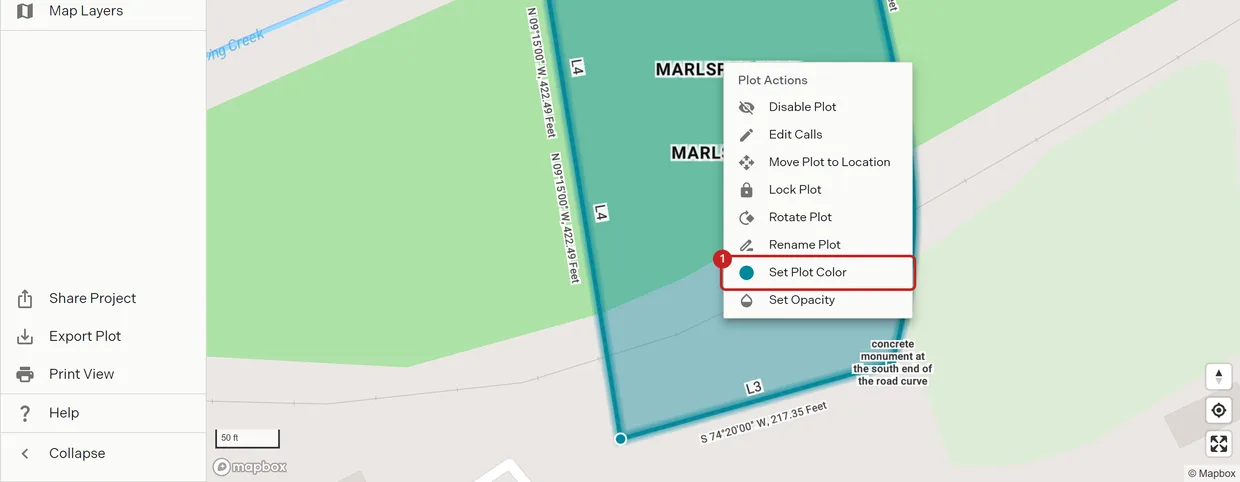
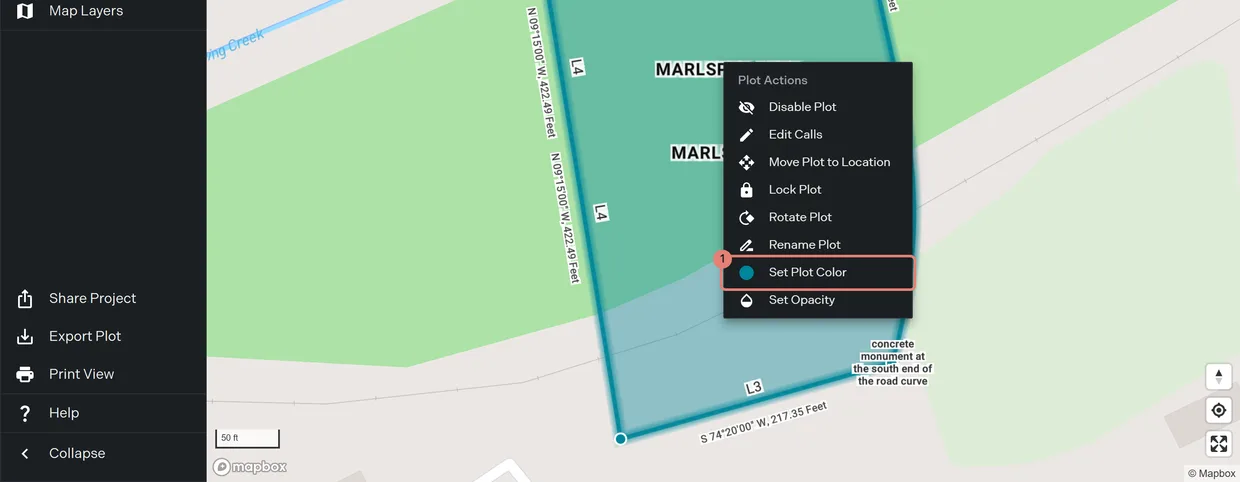
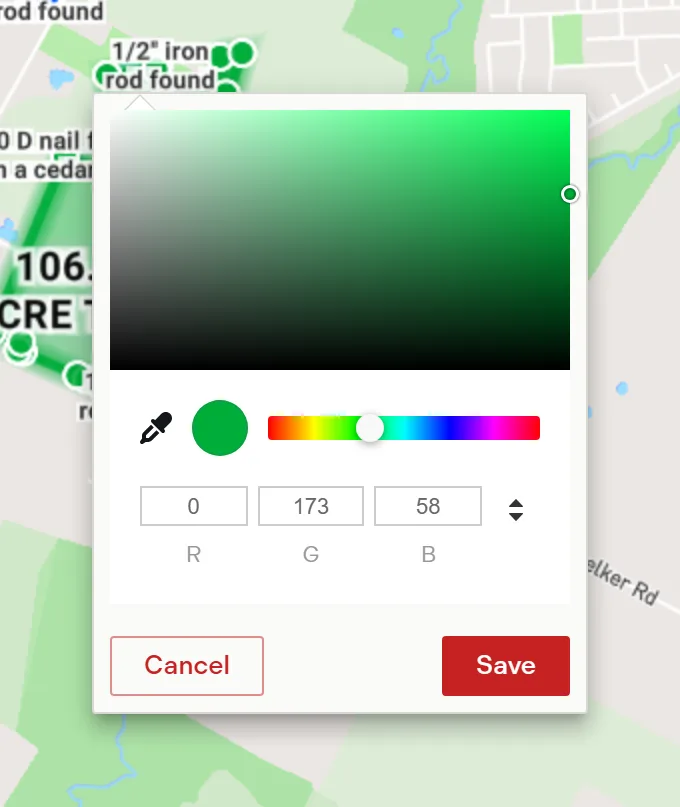
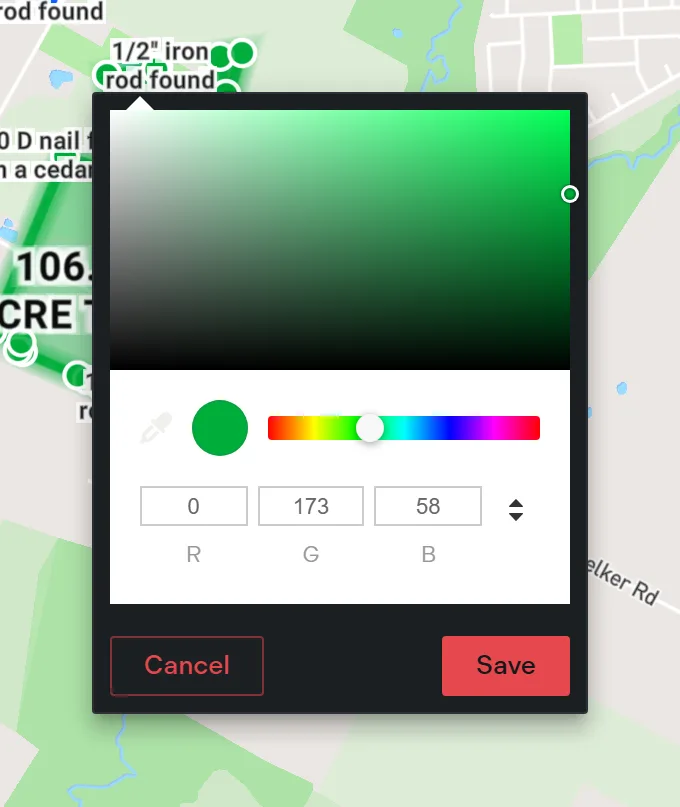
- Set the color with the picker, or type the red, green and blue values.
- Click Save. The boundary redraws in the new color and the layer card’s selection outline follows it.
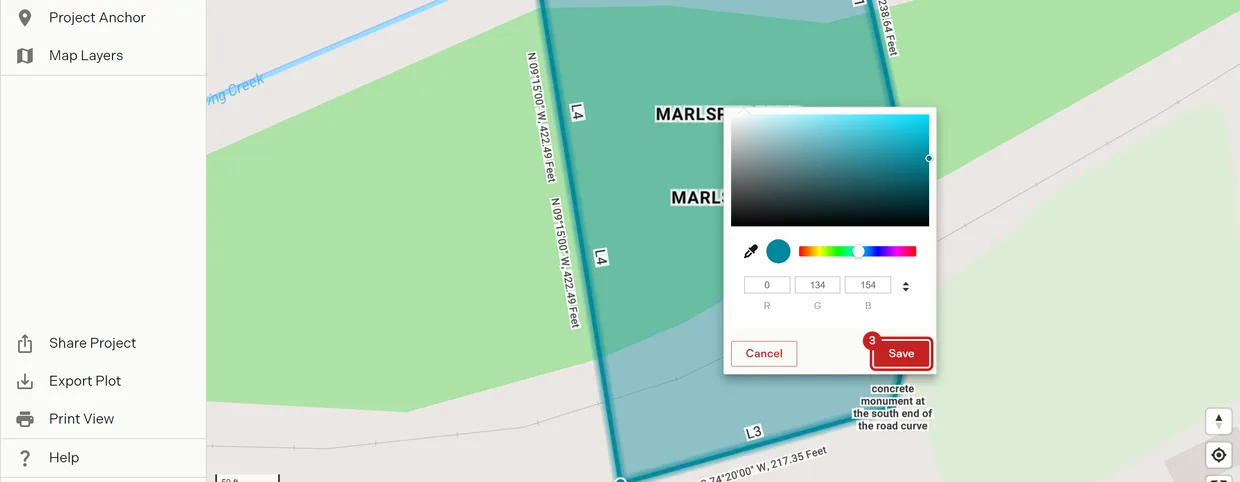
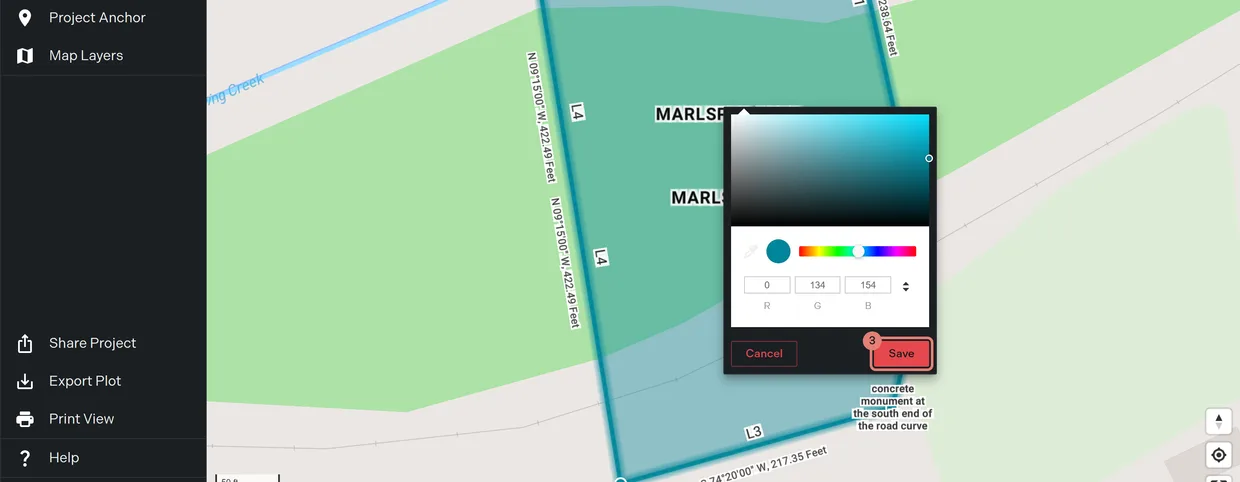
The same picker opens from the layer card’s More actions menu in Manage layers, anchored to the card instead of the map.
Set opacity
- Right-click the plot and choose Set Opacity. The slider opens with its current value in the header, for example
Opacity: 100%. - Drag the slider. The plot on the map redraws as you move it, so you can judge the result against whatever is behind it before you let go.
Opacity has no keyboard shortcut. It is also on the layer card menu.
What color and opacity do not change
Both are display settings on the legal description. Neither touches the calls, the closure figures or the geometry that leaves in an export. A plot you cannot see because its opacity is at zero is still visible to the project drawing; to take it out of the map, the sheet and the exports, hide it instead. Plot actions covers hiding.
Color is per plot, not per layer group. Recoloring a group means recoloring its members.
Related
- Plot actions, for the rest of the right-click menu
- Manage layers, for setting both from the layer card
- Image overlays, for the opacity that matters most, on a scanned plat
- Keyboard shortcuts