

Availability: All plans
Summary
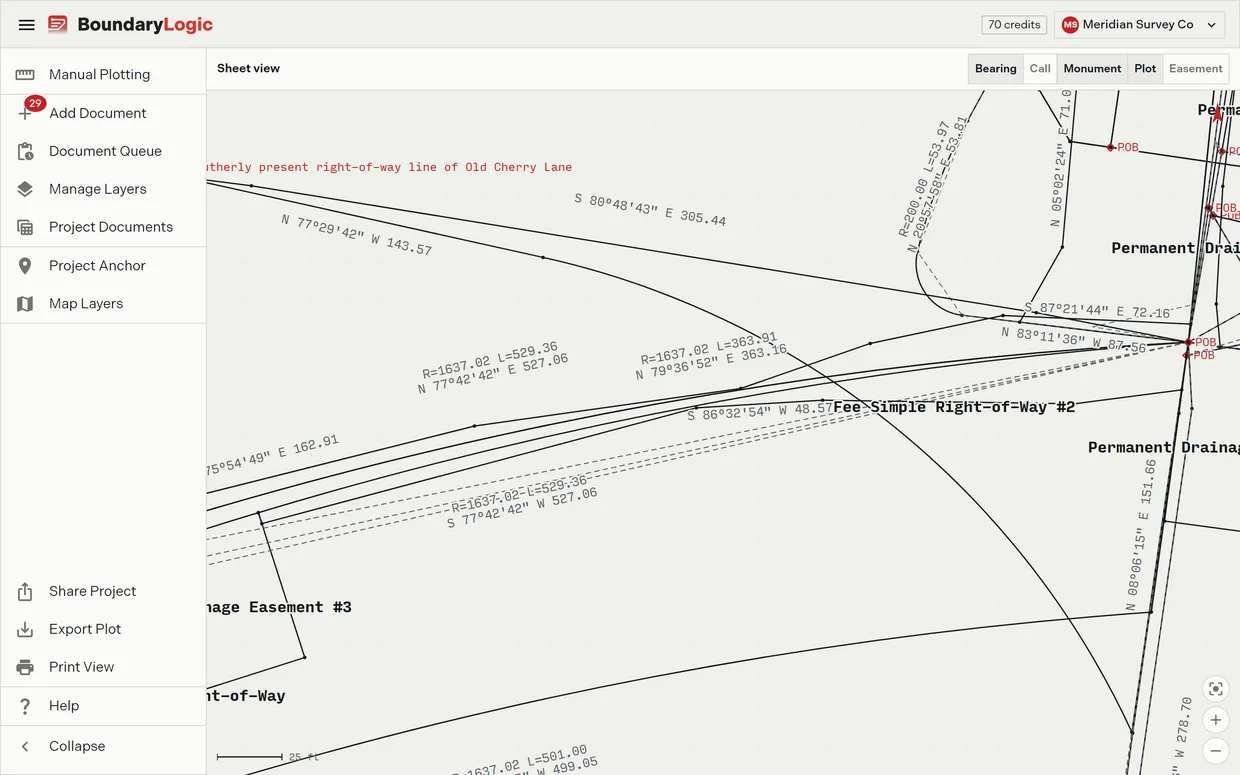
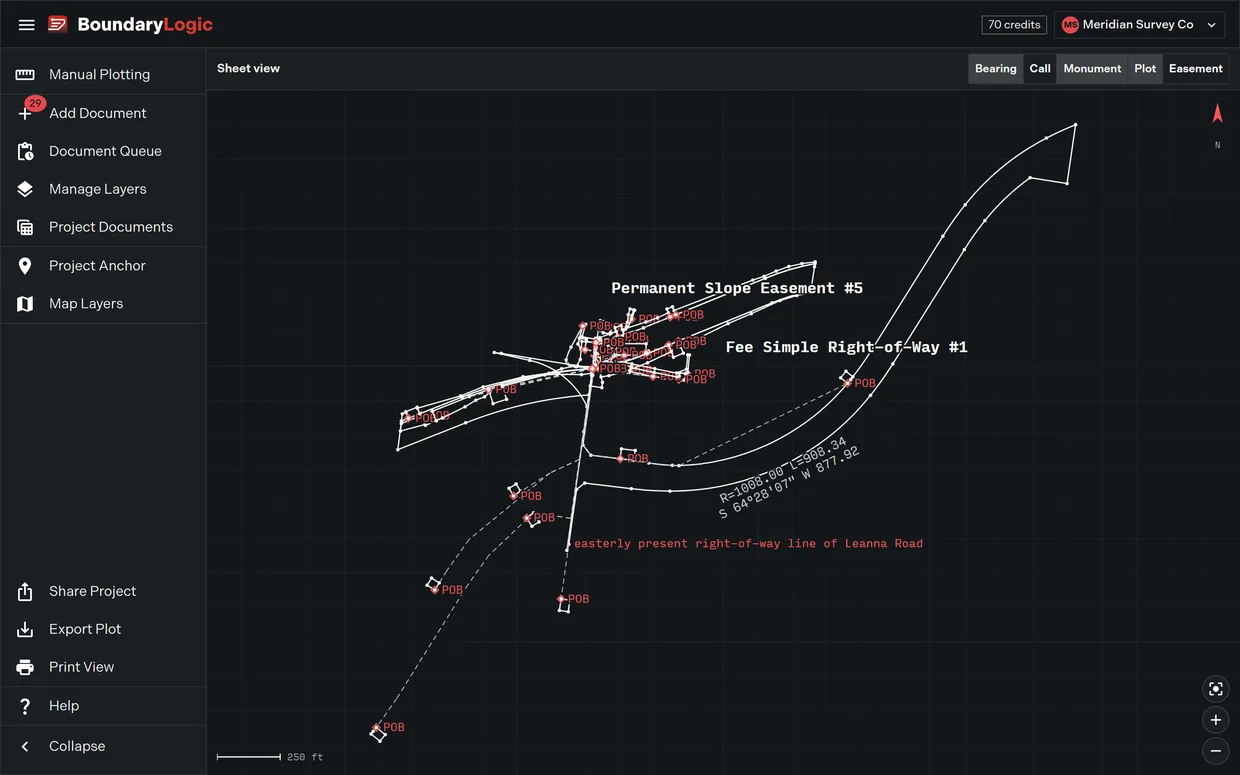
Sheet View draws every visible layer in the project on one plot sheet over a grid, with no imagery behind it. It is a map mode, not a separate workspace, and it is available on every plan. Use it when you want the drawing rather than the location: a clean sheet to read, to capture, or to send to Print View.
Usage notes
Turning it on
In the project menu, click Map Layers, then pick the Sheet View card. Right-clicking empty map and choosing Change Map Style opens the same pane. The workspace swaps the basemap for the sheet, reading “Preparing sheet view…” while it builds.
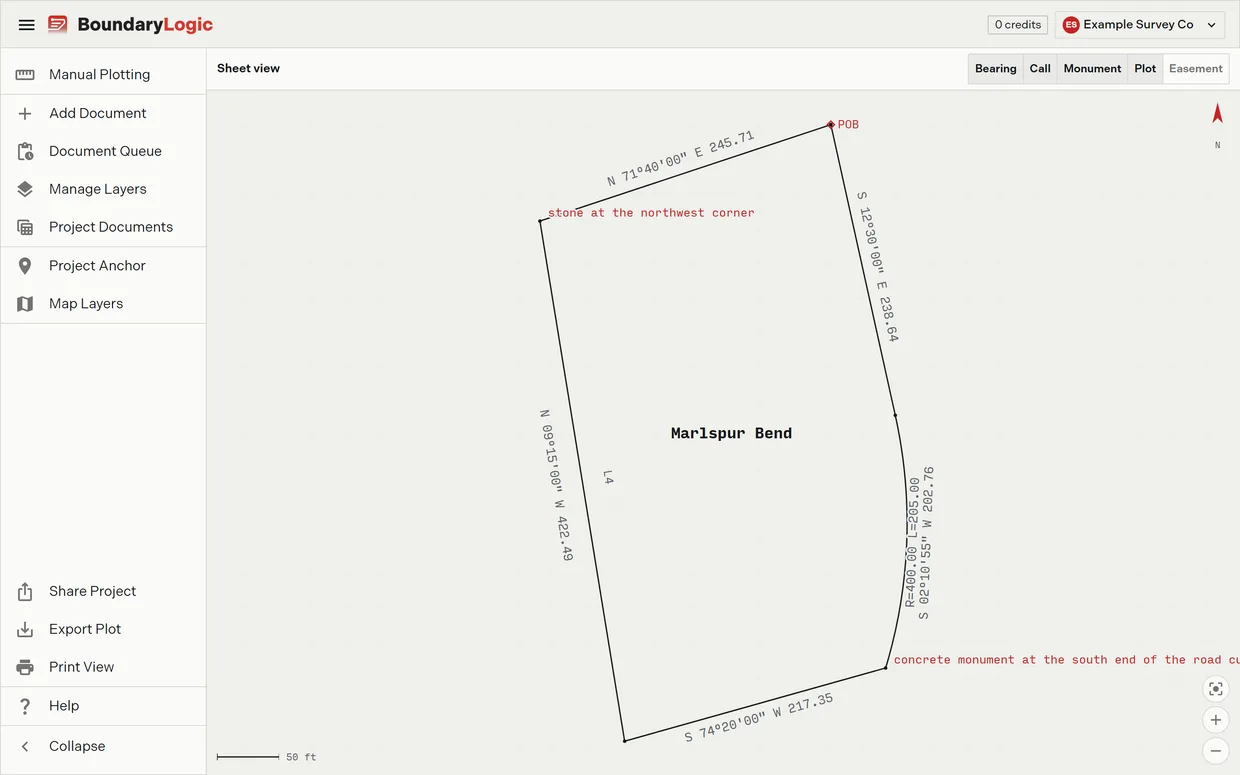
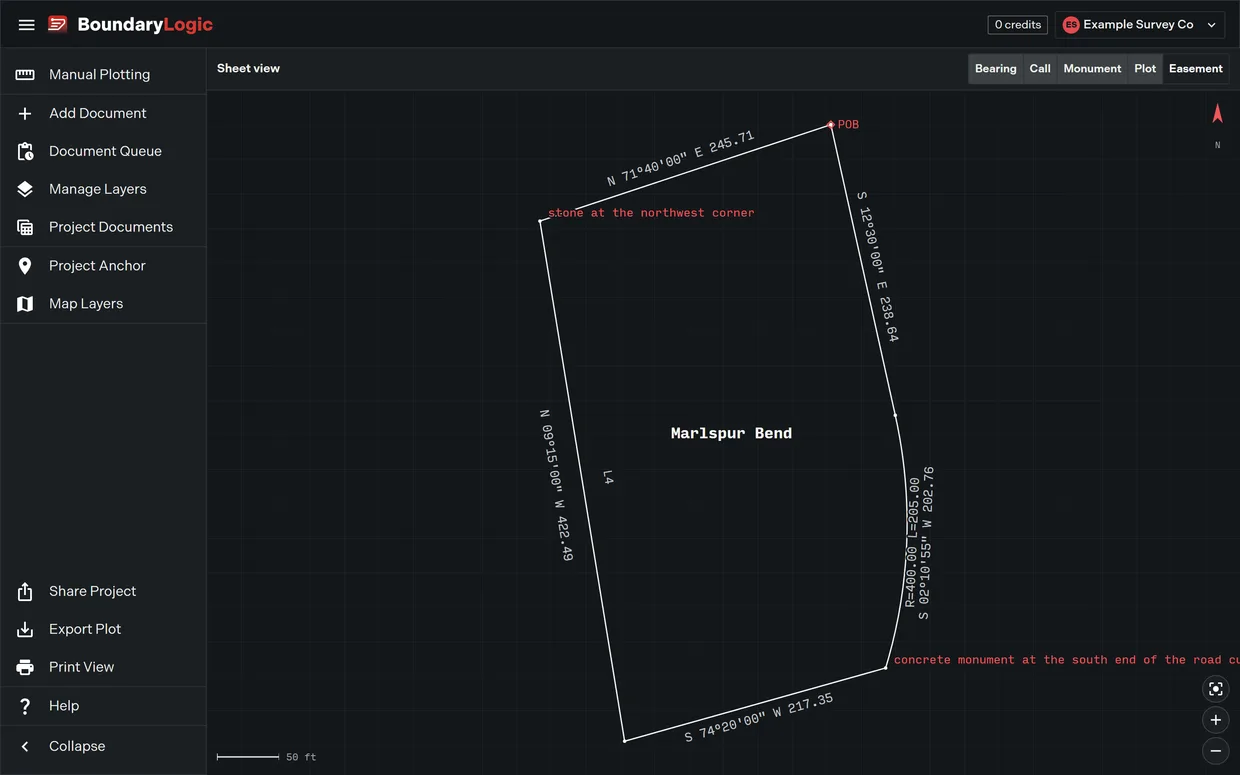
What the sheet shows
Every layer that is visible in Manage layers, and nothing that is hidden. Hiding a layer or a group takes it off the sheet the same way it takes it off the map. The sheet marks north with an arrow and carries its own scale bar.
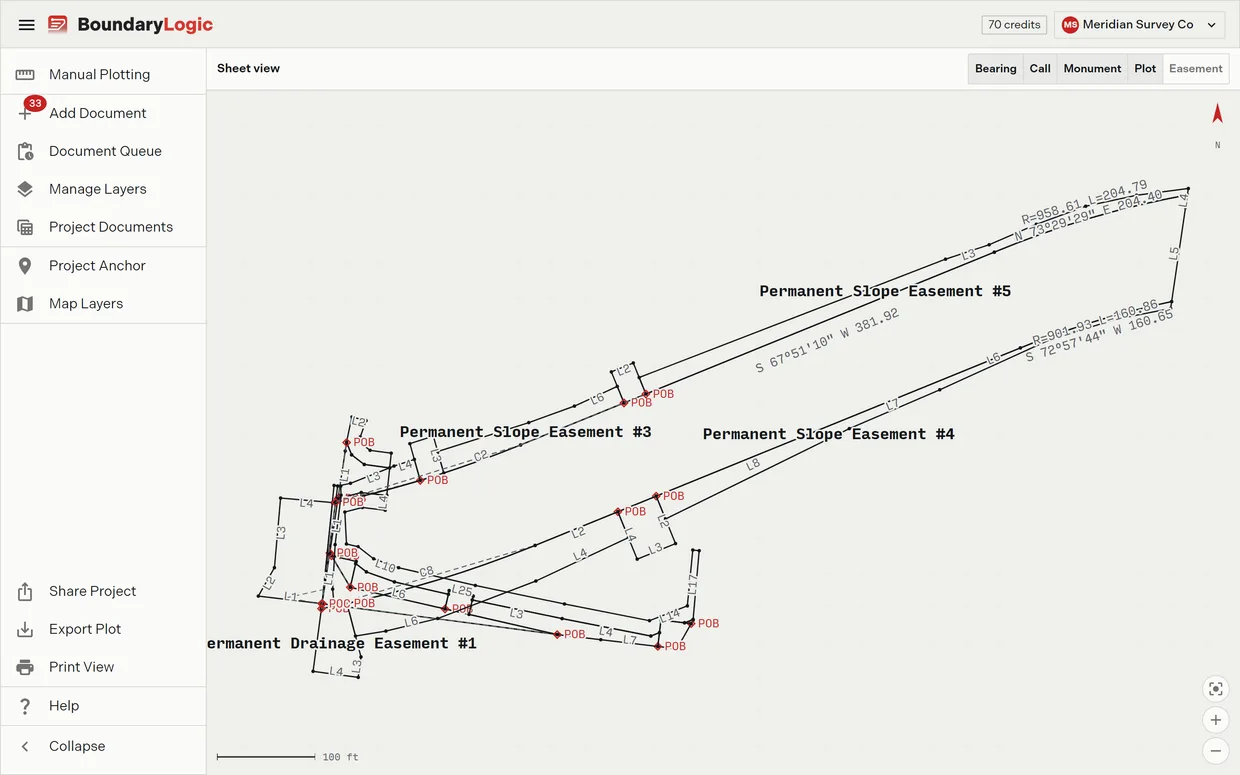
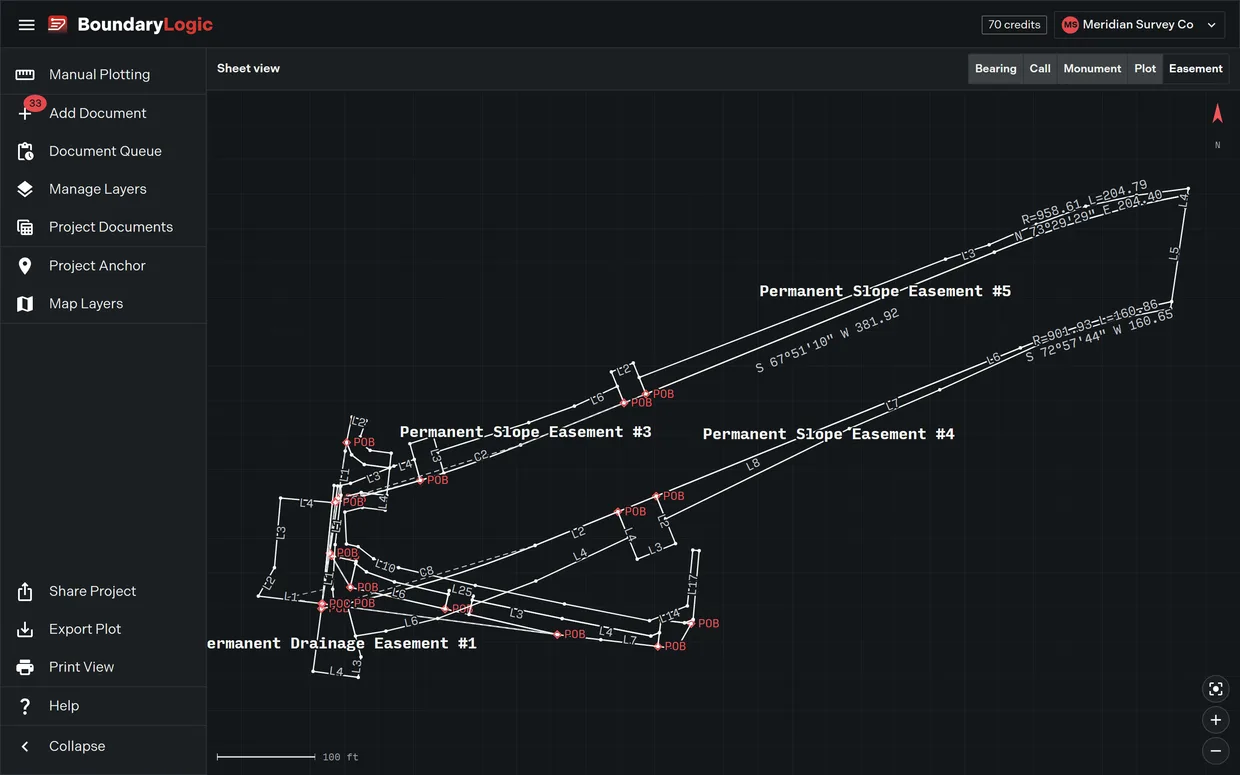
Moving around the sheet
Fit to extents frames the whole drawing again. Zoom with the buttons or the scroll wheel, and drag to pan. The sheet’s own controls stay out of anything captured as an image or a PDF, so a PNG export or a print preview comes back clean.
There is no full screen control on the sheet. Full screen on the map side is the Mapbox control, which expands the map rather than the page.
Labels
The sheet header carries five label switches: Bearing labels, Call markers, Monument labels, Plot name labels and Easement widths. The first four are on by default. Easement widths is off by default and is the one switch the map does not have.
These are the same switches as the map’s Filter Layers menu, sharing one state, so turning a label off on the sheet turns it off on the map too. Labels and markers on the map covers what each one draws.
The sheet is read only
Nothing on the sheet is editable and there is no tract selection: clicking a tract on the sheet does not select it, and no hover readout appears. To work on a plot, switch back to a basemap mode, or open its card in Manage Layers.
Sheet View and View on sheet are different things
Two views look alike at a glance and are not the same.
| Sheet View | View on sheet | |
|---|---|---|
| Where it lives | The map workspace, as a map mode | The manual plotting workspace, as a button |
| What it draws | Every visible layer in the project | The document being edited |
| How you leave | Pick another map mode | Press Esc, or the button, which reads Exit sheet view |
| What it hides | Nothing; it replaces the basemap | The editor and the results panel, so the plot fills the workspace |
Leaving View on sheet puts the editor back exactly as you left it: undo history, cursor position and scroll position all survive the round trip.
Related
- Map modes and styles, for the other eight modes
- Labels and markers on the map
- Manage layers, for controlling what reaches the sheet
- Export a PDF plat, for turning the drawing into a sheet you can send
- From deed stack to one sheet, if you are starting from zero