

Availability: All plans · Role: edit access
Summary
Right-clicking a plot opens Plot Actions, an eight item menu that carries every action Trace runs against one legal description: hide it, edit its calls, move it, lock it, rotate it, rename it, recolor it, and set its opacity. The map toolbar adds rotate, undo and redo. The layer card menu in Manage layers runs the same actions from the pane.
Usage notes
Opening the menu
Right-click the plot. The menu opens under the pointer with a Plot Actions subheader, and shows a skeleton for a moment while the plot loads. Every item except Edit Calls needs edit access; without it they are disabled and Edit Calls reads View Calls.
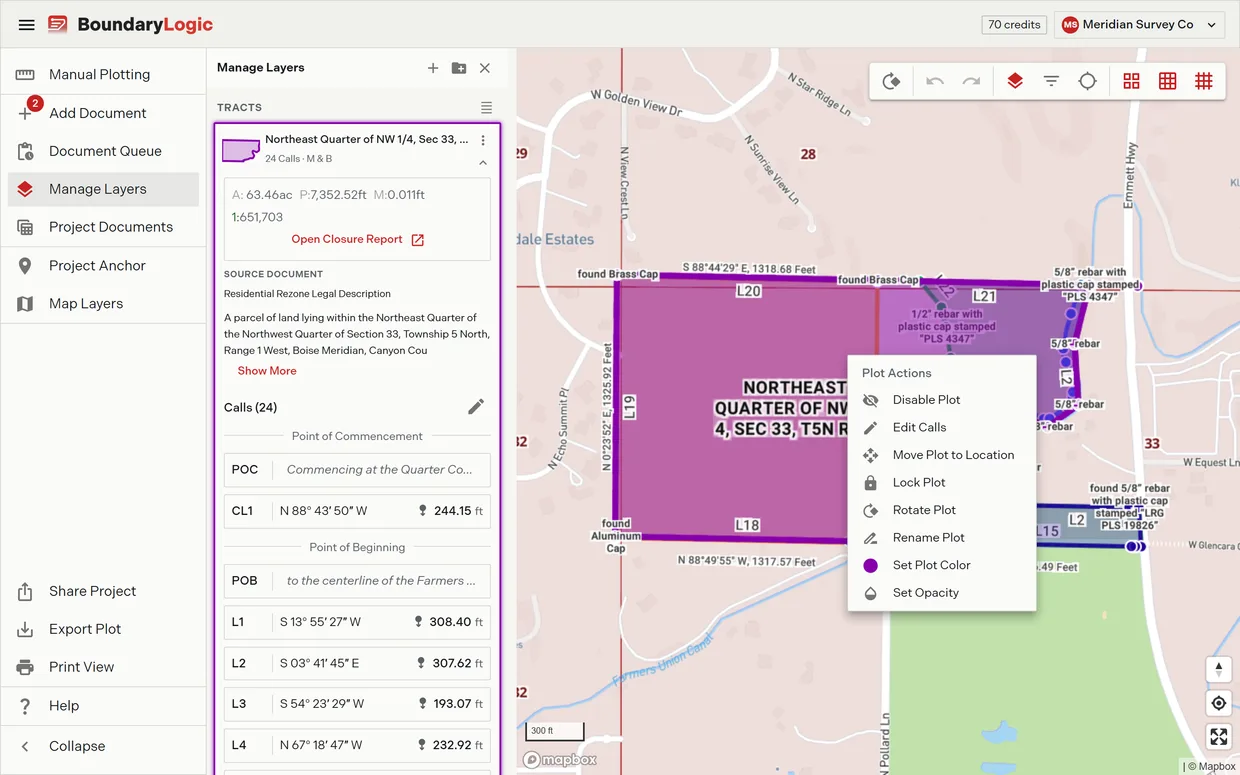
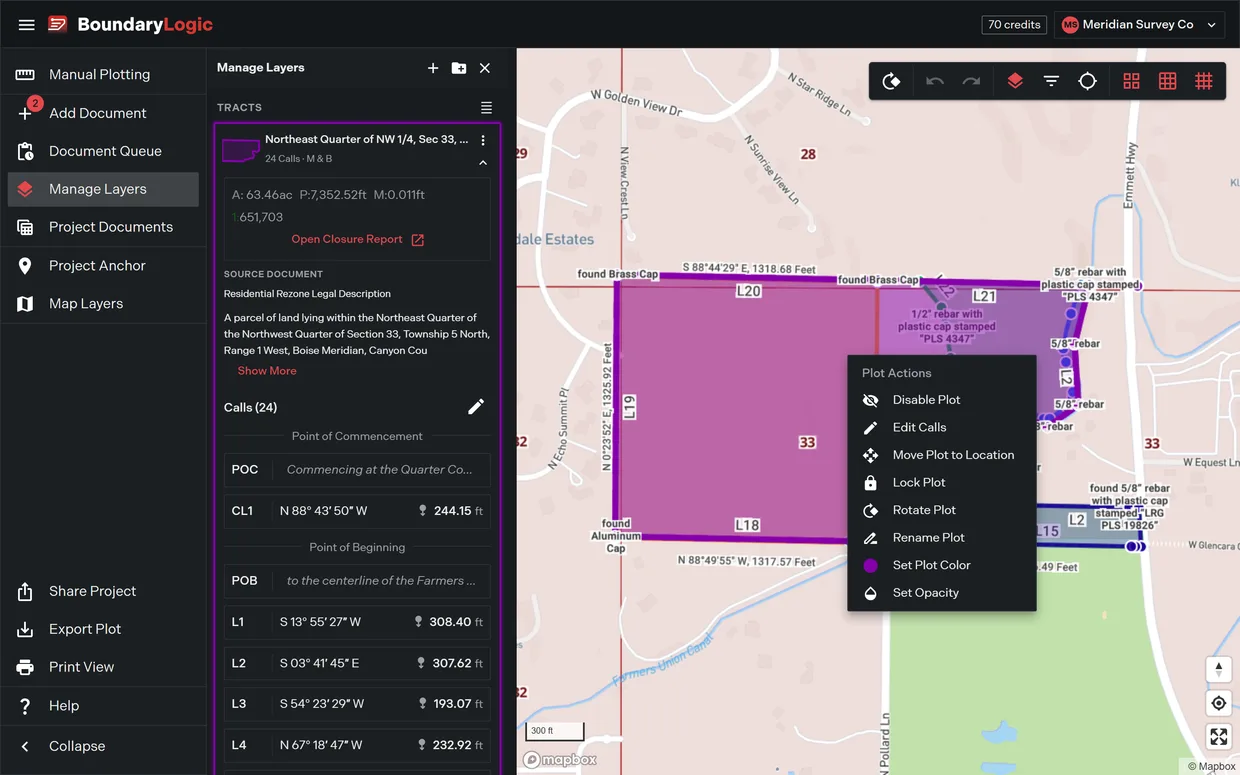
Actions that change what the map draws
Disable Plot takes the plot out of the map, the sheet and every project export at once. The item then reads Enable Plot. This is layer visibility, which is what the workspace actually draws by, so a hidden plot stays in the project and stays in the layer list, dimmed.
Set Plot Color and Set Opacity are covered in Plot color and opacity.
Actions that change where the plot sits
Move Plot to Location opens the dialog that re-anchors the plot by address, coordinates or PLSS description. Move a plot covers it.
Rotate Plot opens the rotate dialog. Pick the legal description, enter the rotation as degrees and minutes, then save. The dialog states the limit plainly: “Rotating a plot will only be a visual impact. Rotation does not impact calls and will only be exported in pdf exports.” The toolbar’s Rotate button opens the same dialog.
Moves and rotations both land on the undo stack. Undo and Redo sit next to Rotate on the toolbar and stay disabled until there is something to reverse. Their tooltips name the action once there is: Undo Move (Ctrl+Z) and Redo Move (Ctrl+Y, Ctrl+Shift+Z). While an undo or redo is running, the map refuses drags, and Rotate and Move Plot to Location are disabled.
What locking does
Lock Plot pins the plot so a stray drag cannot move it. A locked plot is still selectable, still recolorable, still renamable; dragging it pans the map instead of moving it. The menu item reads Unlock Plot while it is locked, and a lock indicator appears on the plot’s layer card. A failed lock shows an error message in the corner.
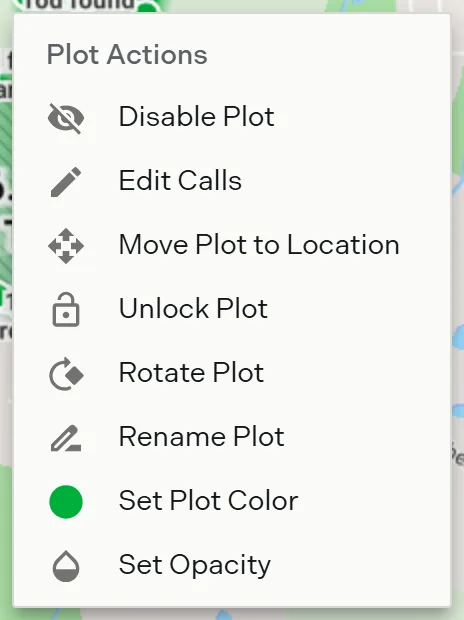
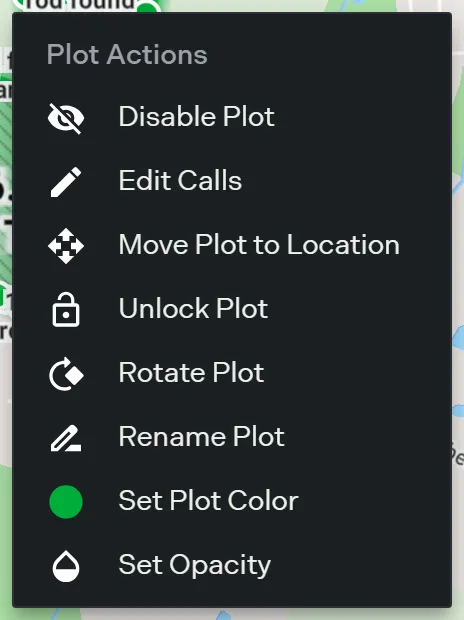
Leaving for the calls
Edit Calls opens the plot’s document in the manual plotting workspace. It is the one item that stays available without edit access, where it reads View Calls and opens read only.
Rename Plot renames the legal description and updates its label on the map without a reload. A name is required.
Options
| Menu item | What it does | Shortcut |
|---|---|---|
| Disable Plot | Hides the plot from the map, the sheet and the exports. Reads Enable Plot when hidden. | Delete |
| Edit Calls | Opens the plot’s document in manual plotting. Reads View Calls without edit access. | E |
| Move Plot to Location | Re-anchors the plot by address, coordinates or PLSS description. | M |
| Lock Plot | Stops the plot being dragged. Reads Unlock Plot when locked. | L |
| Rotate Plot | Opens the degrees and minutes rotate dialog. Visual only. | R |
| Rename Plot | Renames the legal description. | Q |
| Set Plot Color | Sets the boundary color. | C |
| Set Opacity | Sets how transparent the plot draws, previewing as the slider moves. | None |
Related
- Right-click menus on the map, for the overlay and map menus
- Keyboard shortcuts, for the same actions from the keyboard
- Move a plot, for dragging and the move dialog
- Plot color and opacity
- Manage layers, for running these actions from the layer card