

Availability: All plans
Summary
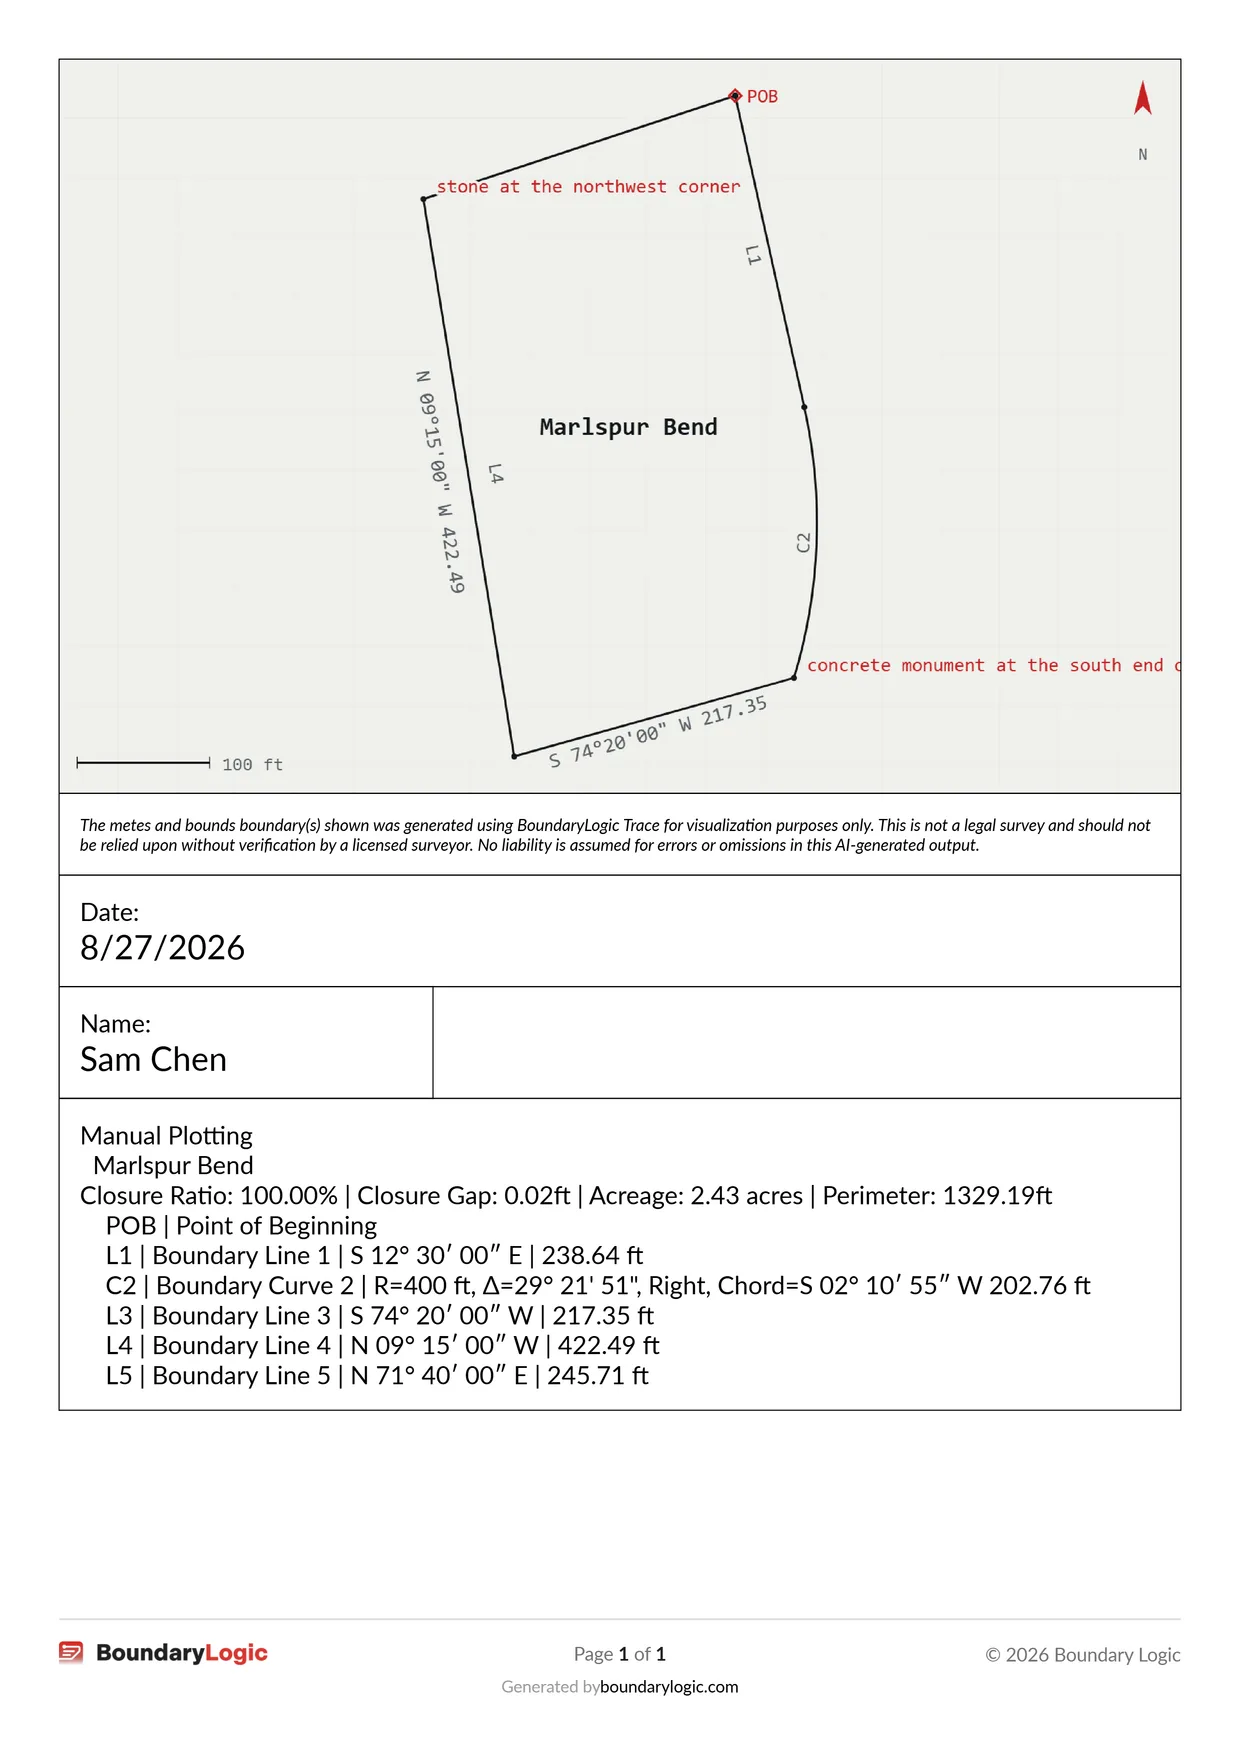
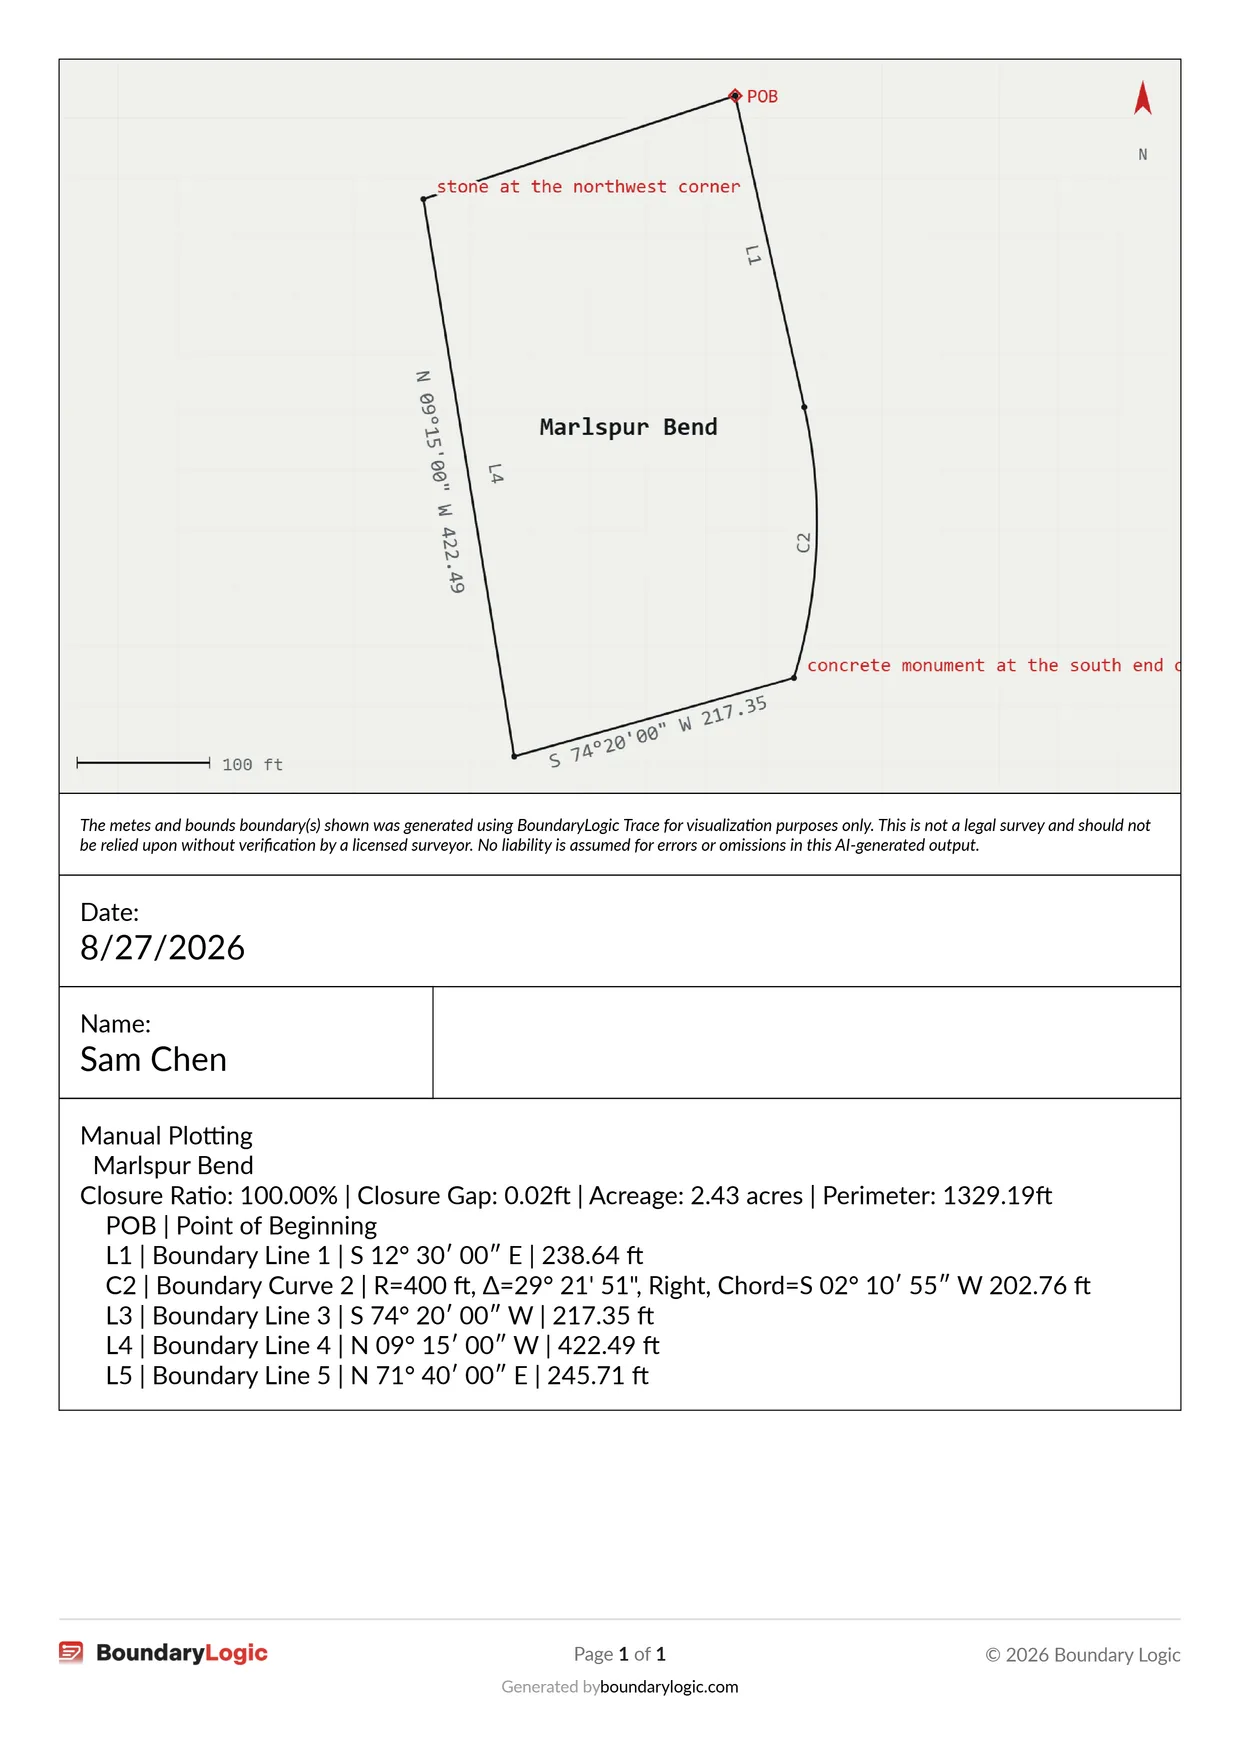
An exported PDF plot sheet prints the drawing, a liability disclaimer, a title block, and a call table for every legal description that was visible when you exported. Nothing in it is editable afterwards, and a few of its captions read differently from the settings panel that produced it. This article covers the file block by block.
Usage notes
The blocks, in order
The file always reads top to bottom in the same order: the plot image, the disclaimer, the title block row, the name and notes row, then the call tables. The plot image sits on page one only, inside a hairline border. The call tables flow across as many pages as they need.
The title block
The first bordered row holds up to three cells, each printing a small caption over a larger value: Title, Scale, and Date. An empty cell is skipped, and the whole row is skipped when all three are empty.
The Scale cell never prints. The file supports it, but the export workspace never sets a scale, so no export can fill it.
The second bordered row holds the preparer under a Name: caption and the notes under a Notes: caption at double width. An empty cell becomes a blank spacer so the row keeps its proportions.
The call tables
The call tables are built from every legal description that was visible at export, grouped under the name of the document each came from. They are never scoped to one selected description. A description whose document has no name is grouped under “Unknown Document”.
Each description prints a metrics line, then one row per call:
- Metrics line. Closure ratio as a percentage, closure gap in feet, acreage, and perimeter in feet. Each is given to two decimals and each falls back to 0.00 when the value is not stored.
- Line calls. The abbreviation, the label, the quadrant bearing in degrees, minutes and seconds, then the distance with its unit.
- Curve calls. Three forms print, depending on how the curve was described: radius with central angle, radius with arc length, or radius with a chord. Each names the turn direction as Left or Right and gives the chord bearing and distance.
- Point rows. A point of beginning or point of commencement prints its abbreviation and label only, with no bearing or distance.
- Commencement courses. Courses running from the point of commencement to the point of beginning print ahead of the boundary courses, with a CL prefix and a Commencement Line label.
A description you typed in the manual plotting workspace prints the same way as one the AI plotted: the same metrics line and the same course by course table, grouped under its own document heading.
The footer
A light grey rule runs across the foot of every page, then three columns: the logo on the left, the page numbers in the centre reading “Page N of M” with the numerals bold, and the copyright on the right naming Boundary Logic and the current year. A centred credit line reads “Generated by boundarylogic.com”, and the domain is a live link.
The logo is the BoundaryLogic Trace combomark at 100 points wide. Where the file carries no logo the cell stays in place, so the page numbers stay centred.
Where the file and the panel disagree
Three captions read differently in the finished file from the way the live preview labels the same value. The numbers are identical; only the wording and the formatting differ. Quote whichever one you are actually reading.
| Value | The preview says | The PDF prints |
|---|---|---|
| The preparer cell | Prepared By | Name: |
| The closure figure on the metrics line | Closure Length | Closure Gap |
| A bearing on a line call | Unpadded, as entered | Zero padded to two digits |
Options
| Block | What it prints | When it is absent |
|---|---|---|
| Plot image | The captured drawing inside a hairline border | Never; page one always carries it |
| Disclaimer | The fixed liability sentence in small italic type | Show BoundaryLogic Trace Disclaimer cleared |
| Title block row | Title, Scale and Date cells | All three cells empty |
| Name and Notes row | The preparer and the notes | Both cells empty |
| Call tables | Metrics and courses per description | Show Legal Description Calls cleared, or every description hidden |
| Footer logo | The combomark, or your team’s logo on Expert | Cleared on Expert and Enterprise |
The disclaimer is fixed
The disclaimer wording cannot be edited anywhere in the product. It states that the boundaries were generated using BoundaryLogic Trace for visualization only, that this is not a legal survey and should not be relied on without verification by a licensed surveyor, and that no liability is assumed for errors or omissions in the AI generated output. You can turn the block off, but you cannot rewrite it.
The file is a snapshot
A generated PDF bakes in the state of the project at the moment it was made. Hiding a layer, renaming a description, or replotting afterwards never reaches a file you already exported. Export again to pick the changes up.
A team on Expert or Enterprise that has uploaded a logo gets that image in the footer in place of the combomark. Title blocks and logos on PDF covers it.
Related
- Export a PDF plat, for producing the file
- Title blocks and logos on PDF, for the footer logo
- The closure report, for the closure figures in full
- Reading the precision ratio, for what a closure ratio means
- Manage layers, for choosing what appears in the tables